I would suggest links to cophenetic on the help pages for dendrogram
and possibly plot.hclust and related functions.
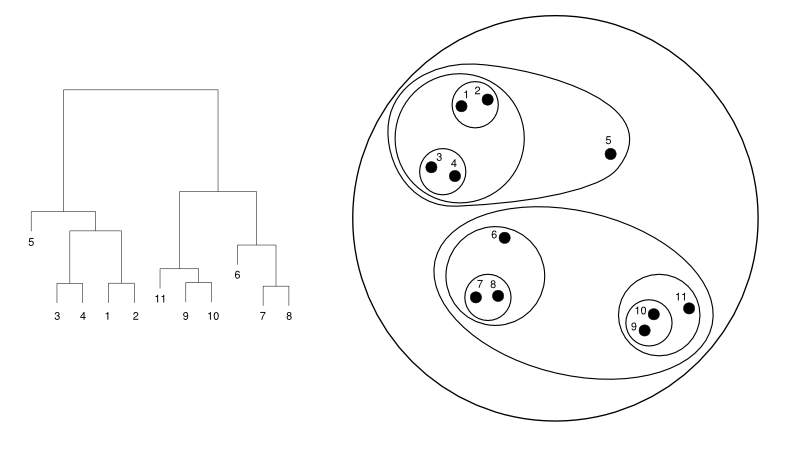
I was not complaining.  I always enjoy learning new things, it is a
testament to the breadth and depth of R that even after more than 25
years using S and R, that I can still be pleasantly surprised with
functions that I did not know about.

The word cophenetic just has a nice ring to it, has a similar rhythm
and rhymes with copacetic (I think I will challenge my writer
co-worker to come up with a poem including both words).  I can see
some of the origin of the word in genetics, but dropped in casual
conversation it could be interpreted to mean any number of things.  I
may ask my wife when I get home if she is feeling cophenetic and want
to cluster after the kids are in bed (though I should be careful not
to agnes, daisy, pam, etc. or she may choose snuggling with the cats
instead of me as her clustering).

On Tue, Oct 28, 2014 at 12:26 PM, Martin Maechler
<maech...@stat.math.ethz.ch> wrote:
>>>>>> Greg Snow <538...@gmail.com>
>>>>>>     on Tue, 28 Oct 2014 10:31:27 -0600 writes:
>
>     > Thanks Martin,  It is always great to learn that I don't need to
>     > reinvent the wheel (especially when I learn that before reinventing).
>
>     > Do you know if there are any help pages that point to cophenetic (see
>     > also or other sections).  Maybe it is just the way that my brain is
>     > wired (along with being a dabbler, but not expert at cluster
>     > analysis), but for some reason the word cophenetic never occurred to
>     > me as a search term while thinking about how to create the requested
> plot.
>
> I understand.  Indeed, the world is never going to be perfect, nor is R.
>
> Currently the only link to 'cophenetic' is in  ?reorder.dendrogram
> and it's easy possible you'd neither have seen that page.
>
> I strongly agree that more \link's would be useful in general
> and in particular for cophenetic. I'm happy to take suggestions,
> notably if they already use  Rd syntax ... ;-)
>
> Martin
>
>     > On Tue, Oct 28, 2014 at 9:31 AM, Martin Maechler
>     > <maech...@stat.math.ethz.ch> wrote:
>     >>>>>>> Greg Snow <538...@gmail.com>
>     >>>>>>> on Mon, 27 Oct 2014 12:33:18 -0600 writes:
>     >>
>     >> > I don't know of any tools that automate this process.  For small
>     >> > sample sizes it may be easiest to just do this by hand, for large
>     >> > sample sizes that plot will probably be to complicated to make sense
>     >> > of.  There may be a range of moderate sample sizes for which
>     >> > automation (or partial automation) would be helpful.  The hclust
>     >> > object has a component of "height" which is an indicator of the
>     >> > distance between 2 components being combined into a cluster, you
> could
>     >> > convert this into a distance matrix
>     >>
>     >> it has been known for many years how to do this; still, I have
>     >> only learned about it from Robert Gentleman (yes, one of the two
>     >> fathers of R), when we added the function
>     >>
>     >> cophenetic()
>     >> to R
>     >> which does exactly do this:
>     >> Provide the distance matrix which is implicitly defined by a
>     >> hierarchical clustering.
>     >>
>     >> Martin Maechler, ETH Zurich
>     >>
>     >> > (or extract the distance matrix used to do the clustering
>     >> > if it is available) and then use multidimensional scaling
>     >> > (cmdscale function is one option) to produce a 2
>     >> > dimensional set of points.  Drawing the
>     >> > circles/ellipses/ovals will be more difficult, possibly
>     >> > generate a cloud of normal points, or a small circle,
>     >> > around each point with the variability/radius low enough
>     >> > that the clouds are unlikely to overlap, then find the
>     >> > convex hull (chull function) for the points within a
>     >> > cluster and draw that (it will be a polygon rather than a
>     >> > smooth curve).  The gBuffer command in the rgeos package
>     >> > may be another way to create polygons around the points in
>     >> > a group.
>     >>
>     >> > On Mon, Oct 27, 2014 at 5:42 AM, David Feitosa
> <davidfeit...@gmail.com> wrote:
>     >> >> Hello!
>     >> >>
>     >> >> I have a code that creates an hclust object.
>     >> >> After the object creation I plot the object as a dendrogram,
>     >> >> similar to the left image of this link:
>     >> >>
>     >> >> http://www.cs.jhu.edu/~razvanm/fs-expedition/hclust-example.png
>     >> >>
>     >> >> I would like to create another image, but similar to the right,
>     >> >> as a set of nested  dots and elipses/circles.
>     >> >>
>     >> >> Anybody knows how to do this?
>     >> >>
>     >> >> Thanks in advance.
>     >> >>
>     >> >> David Feitosa
>     >> >>
>     >> >> (\_(\
>     >> >> (=°;°)
>     >> >> (("")("")
>     >> >>
>     >> >> [[alternative HTML version deleted]]
>     >> >>
>     >> >> ______________________________________________
>     >> >> R-help@r-project.org mailing list
>     >> >> https://stat.ethz.ch/mailman/listinfo/r-help
>     >> >> PLEASE do read the posting guide
> http://www.R-project.org/posting-guide.html
>     >> >> and provide commented, minimal, self-contained, reproducible code.
>     >>
>     >>
>     >>
>     >> > --
>     >> > Gregory (Greg) L. Snow Ph.D.
>     >> > 538...@gmail.com
>     >>
>     >> > ______________________________________________
>     >> > R-help@r-project.org mailing list
>     >> > https://stat.ethz.ch/mailman/listinfo/r-help
>     >> > PLEASE do read the posting guide
> http://www.R-project.org/posting-guide.html
>     >> > and provide commented, minimal, self-contained, reproducible code.
>
>
>
>     > --
>     > Gregory (Greg) L. Snow Ph.D.
>     > 538...@gmail.com


--
Gregory (Greg) L. Snow Ph.D.
538...@gmail.com

______________________________________________
R-help@r-project.org mailing list
https://stat.ethz.ch/mailman/listinfo/r-help
PLEASE do read the posting guide http://www.R-project.org/posting-guide.html
and provide commented, minimal, self-contained, reproducible code.