Thanks Martin,  It is always great to learn that I don't need to
reinvent the wheel (especially when I learn that before reinventing).
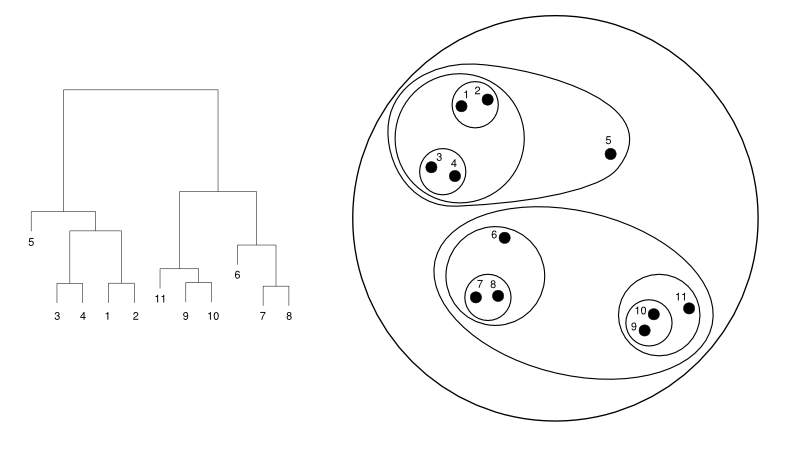
Do you know if there are any help pages that point to cophenetic (see
also or other sections).  Maybe it is just the way that my brain is
wired (along with being a dabbler, but not expert at cluster
analysis), but for some reason the word cophenetic never occurred to
me as a search term while thinking about how to create the requested
plot.

On Tue, Oct 28, 2014 at 9:31 AM, Martin Maechler
<maech...@stat.math.ethz.ch> wrote:
>>>>>> Greg Snow <538...@gmail.com>
>>>>>>     on Mon, 27 Oct 2014 12:33:18 -0600 writes:
>
>     > I don't know of any tools that automate this process.  For small
>     > sample sizes it may be easiest to just do this by hand, for large
>     > sample sizes that plot will probably be to complicated to make sense
>     > of.  There may be a range of moderate sample sizes for which
>     > automation (or partial automation) would be helpful.  The hclust
>     > object has a component of "height" which is an indicator of the
>     > distance between 2 components being combined into a cluster, you could
>     > convert this into a distance matrix
>
> it has been known for many years how to do this; still, I have
> only learned about it from Robert Gentleman (yes, one of the two
> fathers of R), when we added the function
>
>         cophenetic()
> to R
> which does exactly do this:
> Provide the distance matrix which is implicitly defined by a
> hierarchical clustering.
>
> Martin Maechler, ETH Zurich
>
>     > (or extract the distance matrix used to do the clustering
>     > if it is available) and then use multidimensional scaling
>     > (cmdscale function is one option) to produce a 2
>     > dimensional set of points.  Drawing the
>     > circles/ellipses/ovals will be more difficult, possibly
>     > generate a cloud of normal points, or a small circle,
>     > around each point with the variability/radius low enough
>     > that the clouds are unlikely to overlap, then find the
>     > convex hull (chull function) for the points within a
>     > cluster and draw that (it will be a polygon rather than a
>     > smooth curve).  The gBuffer command in the rgeos package
>     > may be another way to create polygons around the points in
>     > a group.
>
>     > On Mon, Oct 27, 2014 at 5:42 AM, David Feitosa <davidfeit...@gmail.com>
> wrote:
>     >> Hello!
>     >>
>     >> I have a code that creates an hclust object.
>     >> After the object creation I plot the object as a dendrogram,
>     >> similar to the left image of this link:
>     >>
>     >> http://www.cs.jhu.edu/~razvanm/fs-expedition/hclust-example.png
>     >>
>     >> I would like to create another image, but similar to the right,
>     >> as a set of nested  dots and elipses/circles.
>     >>
>     >> Anybody knows how to do this?
>     >>
>     >> Thanks in advance.
>     >>
>     >> David Feitosa
>     >>
>     >> (\_(\
>     >> (=°;°)
>     >> (("")("")
>     >>
>     >> [[alternative HTML version deleted]]
>     >>
>     >> ______________________________________________
>     >> R-help@r-project.org mailing list
>     >> https://stat.ethz.ch/mailman/listinfo/r-help
>     >> PLEASE do read the posting guide
> http://www.R-project.org/posting-guide.html
>     >> and provide commented, minimal, self-contained, reproducible code.
>
>
>
>     > --
>     > Gregory (Greg) L. Snow Ph.D.
>     > 538...@gmail.com
>
>     > ______________________________________________
>     > R-help@r-project.org mailing list
>     > https://stat.ethz.ch/mailman/listinfo/r-help
>     > PLEASE do read the posting guide
> http://www.R-project.org/posting-guide.html
>     > and provide commented, minimal, self-contained, reproducible code.


--
Gregory (Greg) L. Snow Ph.D.
538...@gmail.com

______________________________________________
R-help@r-project.org mailing list
https://stat.ethz.ch/mailman/listinfo/r-help
PLEASE do read the posting guide http://www.R-project.org/posting-guide.html
and provide commented, minimal, self-contained, reproducible code.