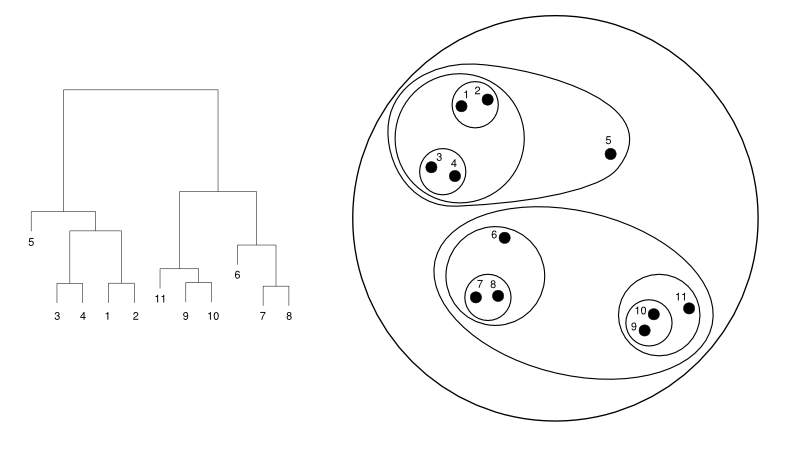
Hello!

I have a code that creates an hclust object.
After the object creation I plot the object as a dendrogram,
similar to the left image of this link:
http://www.cs.jhu.edu/~razvanm/fs-expedition/hclust-example.png

I would like to create another image, but similar to the right,
as a set of nested  dots and elipses/circles.

Anybody knows how to do this?

Thanks in advance.

David Feitosa

(\_(\
(=°;°)
(("")("")

        [[alternative HTML version deleted]]

______________________________________________
R-help@r-project.org mailing list
https://stat.ethz.ch/mailman/listinfo/r-help
PLEASE do read the posting guide http://www.R-project.org/posting-guide.html
and provide commented, minimal, self-contained, reproducible code.