Dylan Beaudette wrote:
Hi,
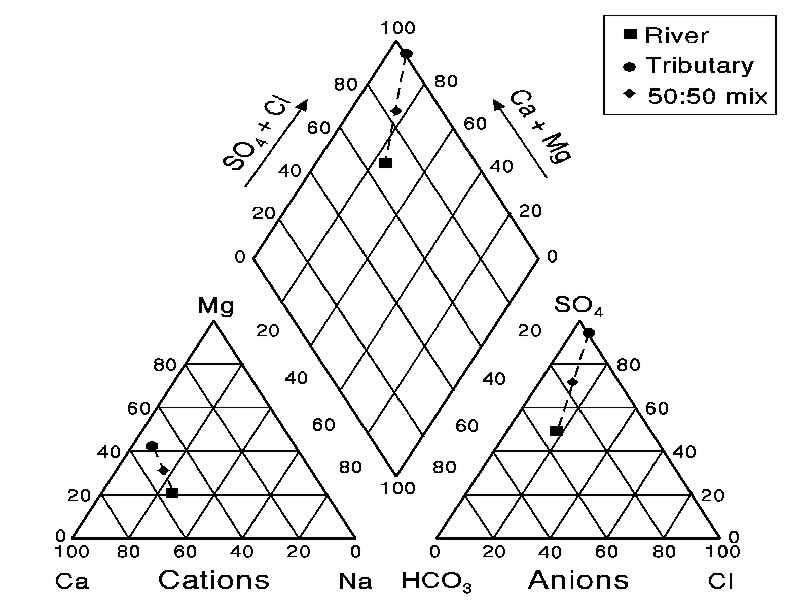
Is anyone on the list familiar with an R implementation of Piper Diagrams?

Example:
http://faculty.uml.edu/nelson_eby/89.315/IMAGES/Figure%209-78.jpg
I am thinking that two calls to triax.plot (plotrix) along with some kind of
affine-transformed standard plot would do the trick. Not so sure about the
final layout, or a nice generalized version for something like lattice.
Hi Dylan,
You're correct about the lower two triangle plots, triax.plot would
handle these (although there would probably be a bit of hacking about to
get the two plots in the right place). I don't understand the upper
rhombus. As a third triangle plot I can get it, but the bottom half
seems to be either redundant or nonsensical (you can't have negative
proportions of components). If I have some time, I'll look up "piper
plot" and try to work out what it all means.
Jim

______________________________________________
R-help@r-project.org mailing list
https://stat.ethz.ch/mailman/listinfo/r-help
PLEASE do read the posting guide http://www.R-project.org/posting-guide.html
and provide commented, minimal, self-contained, reproducible code.