ternaryplot() in the vcd package might help.
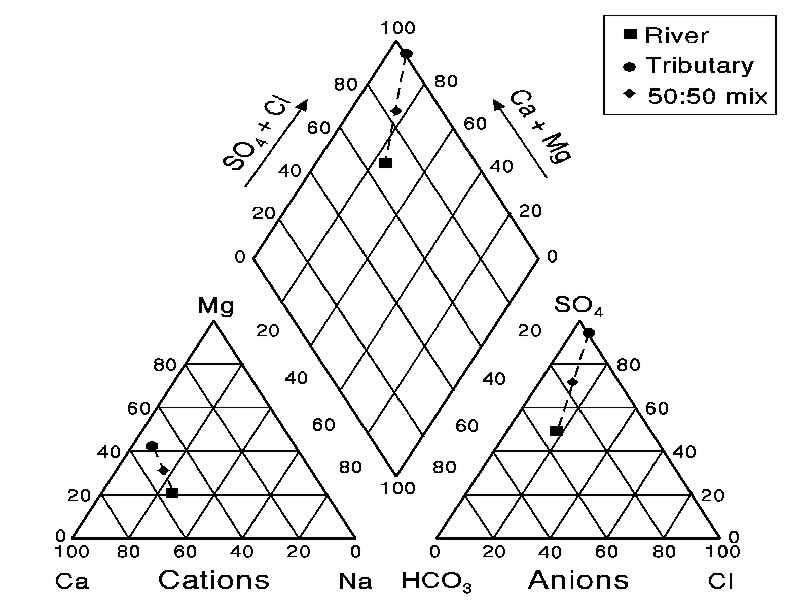
-- Bert Gunter
Genentech Nonclinical Statistics

-----Original Message-----
From: [EMAIL PROTECTED] [mailto:[EMAIL PROTECTED] On
Behalf Of Dylan Beaudette
Sent: Monday, June 09, 2008 1:36 PM
To: R-help@r-project.org
Subject: [R] piper diagram

Hi,

Is anyone on the list familiar with an R implementation of Piper Diagrams?

Example:
http://faculty.uml.edu/nelson_eby/89.315/IMAGES/Figure%209-78.jpg

I am thinking that two calls to triax.plot (plotrix) along with some kind of

affine-transformed standard plot would do the trick. Not so sure about the
final layout, or a nice generalized version for something like lattice.

Cheers,

Dylan

--
Dylan Beaudette
Soil Resource Laboratory
http://casoilresource.lawr.ucdavis.edu/
University of California at Davis
530.754.7341

______________________________________________
R-help@r-project.org mailing list
https://stat.ethz.ch/mailman/listinfo/r-help
PLEASE do read the posting guide http://www.R-project.org/posting-guide.html
and provide commented, minimal, self-contained, reproducible code.

______________________________________________
R-help@r-project.org mailing list
https://stat.ethz.ch/mailman/listinfo/r-help
PLEASE do read the posting guide http://www.R-project.org/posting-guide.html
and provide commented, minimal, self-contained, reproducible code.