Respect R veterans,
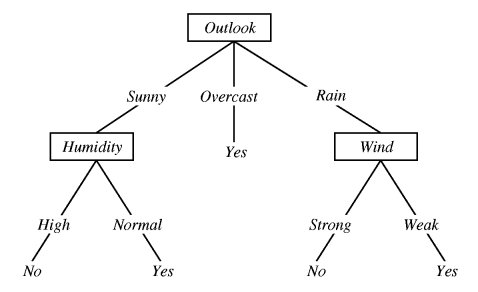
   I am just starting with R and I am having a difficulty in plotting a
rule based decision tree in R.

The problem is, I already have an output from hadoop MapReduce and it is in
the form of a simple text file. Now I want to use this output from Hadoop
and represent it graphically on R. The output file looks something like
this.

1 overcast yes1 rain 3 strong no1 rain 3 weak yes1 sunny 2 high no1
sunny 2 normal yes

Is there a way that I can represent this graphically in R in something
like,

http://web.cs.swarthmore.edu/~meeden/cs63/f05/figure3.1.jpg

Any help will be much appreciated. Thanks

        [[alternative HTML version deleted]]

______________________________________________
R-help@r-project.org mailing list
https://stat.ethz.ch/mailman/listinfo/r-help
PLEASE do read the posting guide http://www.R-project.org/posting-guide.html
and provide commented, minimal, self-contained, reproducible code.