Your scrape interval is 15s, your evaluation interval is 30s, and your
range is 1m. This means that you'd expect your original query to reflect 4
data samples (sensitive, but reasonable in many use cases), and the new
query with the recorded expression will have 2 data samples (incredibly
sensitive, and not particularly useful).
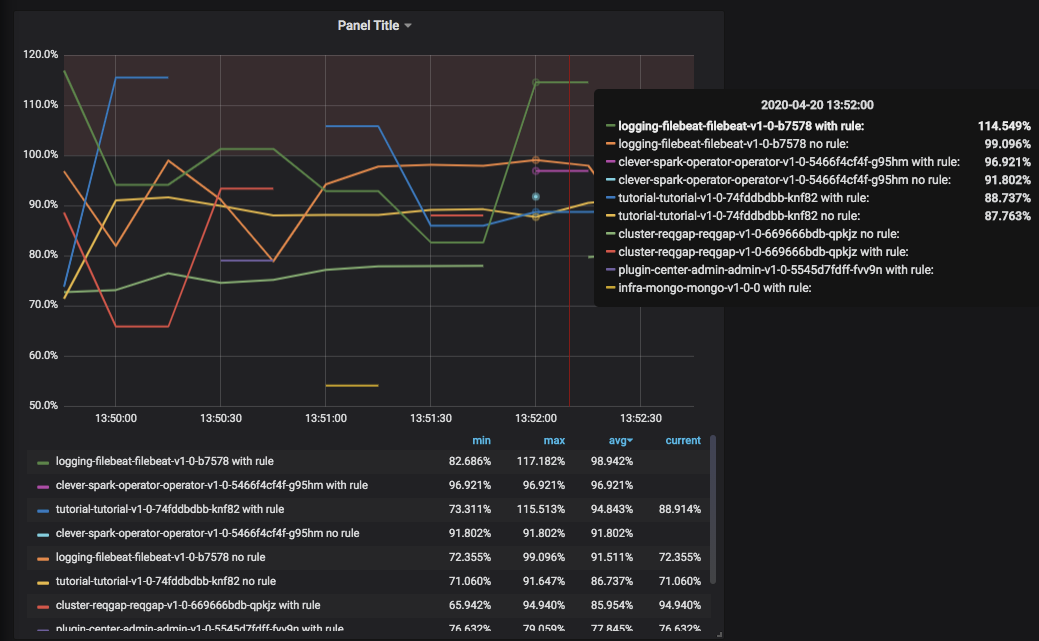
If you want to keep using a range of 1m, I would suggest changing the
recording rule frequency to 15s to match the scrape interval. You'll also
likely see much more comparable results if you use a larger range, such as
5m.

Also, it's absolutely possible for the containers reported usage to go past
the limit. The data isn't perfect, and these artifacts can
happen–particularly when only looking at two data samples.

On Monday, April 20, 2020 at 2:11:39 AM UTC-7, Chuan Li wrote:
>
> I created this GitHub issue
> <https://github.com/prometheus/prometheus/issues/7144> as a bug report,
> but brian-brazil directed me here so I guess it is intended behaviour. The
> original issue can be found below.
>
>
> I don't understand how this is intended behaviour. If
> rate(some_metrics[1m]) work, why shouldn't
> rate(some_metrics/other_metrics_with_constant_value[1m]) ?
>
>
> --- GitHub Issue ---
>
>
> What did you do?
>
> I wanted to calculate container CPU saturation. Without a recording rule I
> would do something like this:
>
> rate(container_cpu_usage_seconds_total{pod!="", container!=""}[1m]) / ON
> (namespace, pod, container) GROUP_LEFT
> kube_pod_container_resource_limits_cpu_cores
>
> Then I wanted to set up a recording rule for this query while retaining
> the ability to change the range selector, so I wrote the recording rule
> like this:
>
>   - record: container_cpu_saturation_total
>     expr: container_cpu_usage_seconds_total{pod!="", container!=""} /
> ON(namespace, pod, container) GROUP_LEFT
> kube_pod_container_resource_limits_cpu_cores
>
> So I could do something like this:
>
> rate(container_cpu_saturation_total[1m])
> rate(container_cpu_saturation_total[5m])
> rate(container_cpu_saturation_total[15m])
>
> What did you expect to see?
>
> I expect the original PromQL and the one with the recording rule to yield
> mostly identical results. Perhaps a margin of error no more than a few
> percents?
>
> What did you see instead? Under which circumstances?
>
> This is the actual result I got:
>
> [image: image]
> <https://user-images.githubusercontent.com/7102510/79717571-99b76280-830c-11ea-9308-aadc7f2d1a59.png>
>
> The difference is rather large. With recording rule, the returned values
> are always higher, sometimes going over 100% which should not be possible.
>
> I tested this on both v2.15.2 and v2.17.1, both versions have this issue
> (the screenshot is from v2.15.2)
>
> Environment
>
>    - System information:
>
> Linux 3.10.0-1062.el7.x86_64 x86_64
>
>    - Prometheus version:
>
> I tested this on both v2.15.2 and v2.17.1, both versions have this issue
> (the screenshot is from v2.15.2)
>
>    - Prometheus configuration file:
>
> global:
>   scrape_interval: 15s
>   scrape_timeout: 10s
>   evaluation_interval: 30s
>
> alerting:
>   alertmanagers:
>   - static_configs:
>     - targets:
>       - 10.200.13.200:6007
>     scheme: http
>     timeout: 10s
>     api_version: v1
>
> rule_files:
> - /config/*.recording.yml
> - /config/*.alerting.yml
>
> scrape_configs:
>
> (other irrelevant config)
>
> - job_name: cadvisor
>   honor_timestamps: true
>   scrape_interval: 15s
>   scrape_timeout: 10s
>   metrics_path: /metrics/cadvisor
>   scheme: https
>   kubernetes_sd_configs:
>   - role: node
>   tls_config:
>     ca_file: /secrets/kubelet/ca
>     cert_file: /secrets/kubelet/cert
>     key_file: /secrets/kubelet/key
>     insecure_skip_verify: false
>
> - job_name: kube-state-metrics
>   honor_timestamps: true
>   scrape_interval: 15s
>   scrape_timeout: 10s
>   metrics_path: /metrics
>   scheme: http
>   kubernetes_sd_configs:
>   - role: service
>     namespaces:
>       names:
>       - kube-system
>   relabel_configs:
>   - source_labels: [__meta_kubernetes_service_name]
>     separator: ;
>     regex: kube-state-metrics
>     replacement: $1
>     action: keep
>
>
> here is another screenshot with graph instead of instant query
>
> [image: image]
> <https://user-images.githubusercontent.com/7102510/79718322-5bbb3e00-830e-11ea-88cb-78cc84dd9614.png>
>
>

--
You received this message because you are subscribed to the Google Groups
"Prometheus Users" group.
To unsubscribe from this group and stop receiving emails from it, send an email
to [email protected].
To view this discussion on the web visit
https://groups.google.com/d/msgid/prometheus-users/1940422e-5db7-41f7-a7aa-e50392c1ef2d%40googlegroups.com.