I created this GitHub issue
<https://github.com/prometheus/prometheus/issues/7144> as a bug report, but
brian-brazil directed me here so I guess it is intended behaviour. The
original issue can be found below.
I don't understand how this is intended behaviour. If rate(some_metrics[1m])
work, why shouldn't rate(some_metrics/other_metrics_with_constant_value[1m])
?
--- GitHub Issue ---
What did you do?
I wanted to calculate container CPU saturation. Without a recording rule I
would do something like this:
rate(container_cpu_usage_seconds_total{pod!="", container!=""}[1m]) / ON
(namespace, pod, container) GROUP_LEFT
kube_pod_container_resource_limits_cpu_cores
Then I wanted to set up a recording rule for this query while retaining the
ability to change the range selector, so I wrote the recording rule like
this:
- record: container_cpu_saturation_total
expr: container_cpu_usage_seconds_total{pod!="", container!=""} /
ON(namespace, pod, container) GROUP_LEFT
kube_pod_container_resource_limits_cpu_cores
So I could do something like this:
rate(container_cpu_saturation_total[1m])
rate(container_cpu_saturation_total[5m])
rate(container_cpu_saturation_total[15m])
What did you expect to see?
I expect the original PromQL and the one with the recording rule to yield
mostly identical results. Perhaps a margin of error no more than a few
percents?
What did you see instead? Under which circumstances?
This is the actual result I got:
[image: image]
<https://user-images.githubusercontent.com/7102510/79717571-99b76280-830c-11ea-9308-aadc7f2d1a59.png>
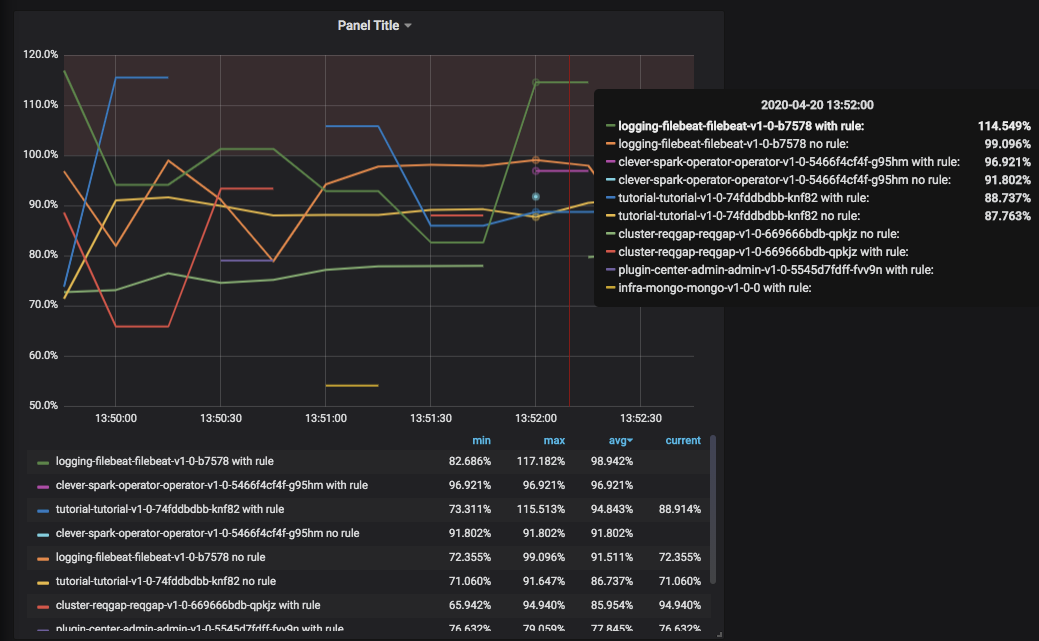
The difference is rather large. With recording rule, the returned values
are always higher, sometimes going over 100% which should not be possible.
I tested this on both v2.15.2 and v2.17.1, both versions have this issue
(the screenshot is from v2.15.2)
Environment
- System information:
Linux 3.10.0-1062.el7.x86_64 x86_64
- Prometheus version:
I tested this on both v2.15.2 and v2.17.1, both versions have this issue
(the screenshot is from v2.15.2)
- Prometheus configuration file:
global:
scrape_interval: 15s
scrape_timeout: 10s
evaluation_interval: 30s
alerting:
alertmanagers:
- static_configs:
- targets:
- 10.200.13.200:6007
scheme: http
timeout: 10s
api_version: v1
rule_files:
- /config/*.recording.yml
- /config/*.alerting.yml
scrape_configs:
(other irrelevant config)
- job_name: cadvisor
honor_timestamps: true
scrape_interval: 15s
scrape_timeout: 10s
metrics_path: /metrics/cadvisor
scheme: https
kubernetes_sd_configs:
- role: node
tls_config:
ca_file: /secrets/kubelet/ca
cert_file: /secrets/kubelet/cert
key_file: /secrets/kubelet/key
insecure_skip_verify: false
- job_name: kube-state-metrics
honor_timestamps: true
scrape_interval: 15s
scrape_timeout: 10s
metrics_path: /metrics
scheme: http
kubernetes_sd_configs:
- role: service
namespaces:
names:
- kube-system
relabel_configs:
- source_labels: [__meta_kubernetes_service_name]
separator: ;
regex: kube-state-metrics
replacement: $1
action: keep
here is another screenshot with graph instead of instant query
[image: image]
<https://user-images.githubusercontent.com/7102510/79718322-5bbb3e00-830e-11ea-88cb-78cc84dd9614.png>
--
You received this message because you are subscribed to the Google Groups
"Prometheus Users" group.
To unsubscribe from this group and stop receiving emails from it, send an email
to [email protected].
To view this discussion on the web visit
https://groups.google.com/d/msgid/prometheus-users/05d4aae7-6e30-455a-bf46-638cbcb9e088%40googlegroups.com.