xinyiZzz opened a new pull request, #9145:
URL: https://github.com/apache/incubator-doris/pull/9145
# Proposed changes Issue Number: close #7196 ## Problem Summary: 1. fix track bthread - Bthread, a high performance M:N thread library used by brpc. In Doris, a brpc server response runs on one bthread, possibly on multiple pthreads. Currently, MemTracker consumption relies on pthread local variables (TLS). - This caused pthread TLS MemTracker confusion when switching pthread TLS MemTracker in brpc server response. So replacing pthread TLS with bthread TLS in the brpc server response saves the MemTracker. Ref: https://github.com/apache/incubator-brpc/blob/731730da85f6af5c25012b4c83ab5bb371320cf8/docs/en/server.md#bthread-local 2. fix track vectorized query - Added track mmap. Currently, mmap allocates memory in many places of the vectorized execution engine. - Refactored ThreadContext to avoid dependency conflicts and make it easier to debug. ## Checklist(Required) 1. Does it affect the original behavior: (Yes) 2. Has unit tests been added: (No) 3. Has document been added or modified: (No) 4. Does it need to update dependencies: (No) 5. Are there any changes that cannot be rolled back: (Yes) ## Further comments ## 1. Stability ### 1) `mem_limit=10M` This means that the memory limit of the BE process is 10M. At this time, the BE process will still start normally, but cannot do anything, and the query will return an error: This means that after BE is started, the process mem limit has left -156M. ```` ERROR 1105 (HY000): errCode = 2, detailMessage = Memory exceed limit. fragment=89c882f82fa74db1-b8010703e7974fed, details=PartitionedHashTableCtx::ExprValuesCache failed to allocate 53760 bytes, on backend=10.81.85.89. Memory left in process limit=-156100257.00 B . failed alloc=<Memory limit exceeded: ExecNode:Exprs:AGGREGATION_NODE (id=65): TryConsume failed, bytes=53760 process whole consumption=244424704 mem limit=10485760>. current tracker=ExecNode:Exprs:AGGREGATION_NODE (id=65) . If this is a query, can change the limit b ```` ### 2) `mem_limit=80% (default), set exec_mem_limit=10M` The query returns the error: At this time, the query mem limit is 10485760B, 10464520B has been used, and the re-allocation of 32768B fails. The memory application information reported when switching the MemTracker is `aggregator, while execute get_next`, the tracker belongs to `ExecNode:VAGGREGATION_NODE`, and the consumption of the tracker in the TCMalloc Hook fails. ```` ERROR 1105 (HY000): errCode = 2, detailMessage = Memory limit exceeded: Memory exceed limit. fragment=, details=In TCMalloc Hook, aggregator, while execute get_next., on backend=10.81.85.89. Memory left in process limit=300.81 GB. failed alloc=<Memory limit exceeded: label=queryId=fdb6664525fe40f9-8bc275d2c86d2546 TryConsume failed size=32768, used=10464520, limit=10485760>. current tracker=ExecNode:VAGGREGATION_NODE (id=24). If this is a query, can change the limit by session variable exec_mem_limit. ```` ### 3) `mem_limit=99%, set exec_mem_limit=20G` (waiting for the test..., expecting BE will not crash) ## 2. Performance Similar to #8669 test conclusion on row storage, the new memory statistics framework will also bring about a 2% performance loss on vectorized queries. For POC performance testing, consider turning off the detailed memory track `memory_verbose_track=false`, which will avoid a 1% performance loss, and further completely turn off the memory track `track_new_delete=false`, which will further avoid a 1% performance loss. ### 1) TEST 1 - SSB 600w ``` Env: 1 FE, 1 BE; Test Set: ssb LINEORDER 600w; Default session veriables; jmeter thread=20; ``` | conf | Q1.1(qps, avg time ms) | Q1.2 | Q1.3 | Q2,1 | Q2.2 | Q3.1 | Q4.1 | | ------------ | ------------ | ------------ | ------------ | ------------ | ------------ | ------------ | ------------ | | track_new_delete=false | 175.0/s, 110 ms | 214.1/s, 90 ms | 225.7/s, 86 ms | 72.5/s, 268 ms | 71.6/s, 272 ms | 68.0/s, 286 ms | 45.8/s, 424 ms | | track_new_delete=true | 170.1/s, 114 ms | 211.6/s, 91 ms | 222.9/s, 87 ms | 72.1/s, 269 ms | 71.3/s, 273 ms | 67.5/s, 288 ms | 45.7/s, 427 ms | ### 2) TEST 2 - SSB 60003w ``` Env: 1 FE, 1 BE; Test Set: ssb LINEORDER 60003w; Default session veriables; jmeter thread=1; ``` | conf | Q1.1(qps, avg time ms) | Q1.2 | Q1.3 | Q2,1 | Q2.2 | Q3.1 | Q4.1 | | ------------ | ------------ | ------------ | ------------ | ------------ | ------------ | ------------ | ------------ | | track_new_delete=false | 175.0/s, 110 ms | 214.1/s, 90 ms | 225.7/s, 86 ms | 72.5/s, 268 ms | 71.6/s, 272 ms | 68.0/s, 286 ms | 45.8/s, 424 ms | | track_new_delete=true | 170.1/s, 114 ms | 211.6/s, 91 ms | 222.9/s, 87 ms | 72.1/s, 269 ms | 71.3/s, 273 ms | 67.5/s, 288 ms | 45.7/s, 427 ms | ### 3) TEST 3 - small query ``` Env: 1 FE, 1 BE; Test Set: ssb LINEORDER 600w; Default session veriables; jmeter thread=20; ``` | conf | select LO_EXTENDEDPRICE from LINEORDER2 where LO_EXTENDEDPRICE = 5273584 limit 1; | | ------------ | ------------ | | track_new_delete=false | 8275.7/s, 11 ms | | track_new_delete=true | 8203.6/s, 11 ms | ## 3. Observability ``` Env: 1 FE, 1 BE Test Set: ssb LINEORDER 60003w track_new_delete=true memory_verbose_trace=true set parallel_fragment_exec_instance_num=2; Test SQL: SSB Q3.1 SELECT C_NATION, S_NATION, D_YEAR, SUM(LO_REVENUE) AS REVENUE FROM customer, lineorder, supplier, dates WHERE LO_CUSTKEY = C_CUSTKEY AND LO_SUPPKEY = S_SUPPKEY AND LO_ORDERDATE = D_DATEKEY AND C_REGION = 'ASIA' AND S_REGION = 'ASIA' AND D_YEAR >= 1992 AND D_YEAR <= 1997 GROUP BY C_NATION, S_NATION, D_YEAR ORDER BY D_YEAR ASC, REVENUE DESC; ``` ``` // The Level use to decide whether to show it in web page, // each MemTracker have a Level less than or equal to parent, only be set explicit, // TASK contains query, import, compaction, etc. enum class MemTrackerLevel { OVERVIEW = 0, TASK, INSTANCE, VERBOSE }; see: BeIP:HttpPort/mem_tracker ```` 1. mem_tracker_level=0 (default OVERVIEW) > init  > query ing 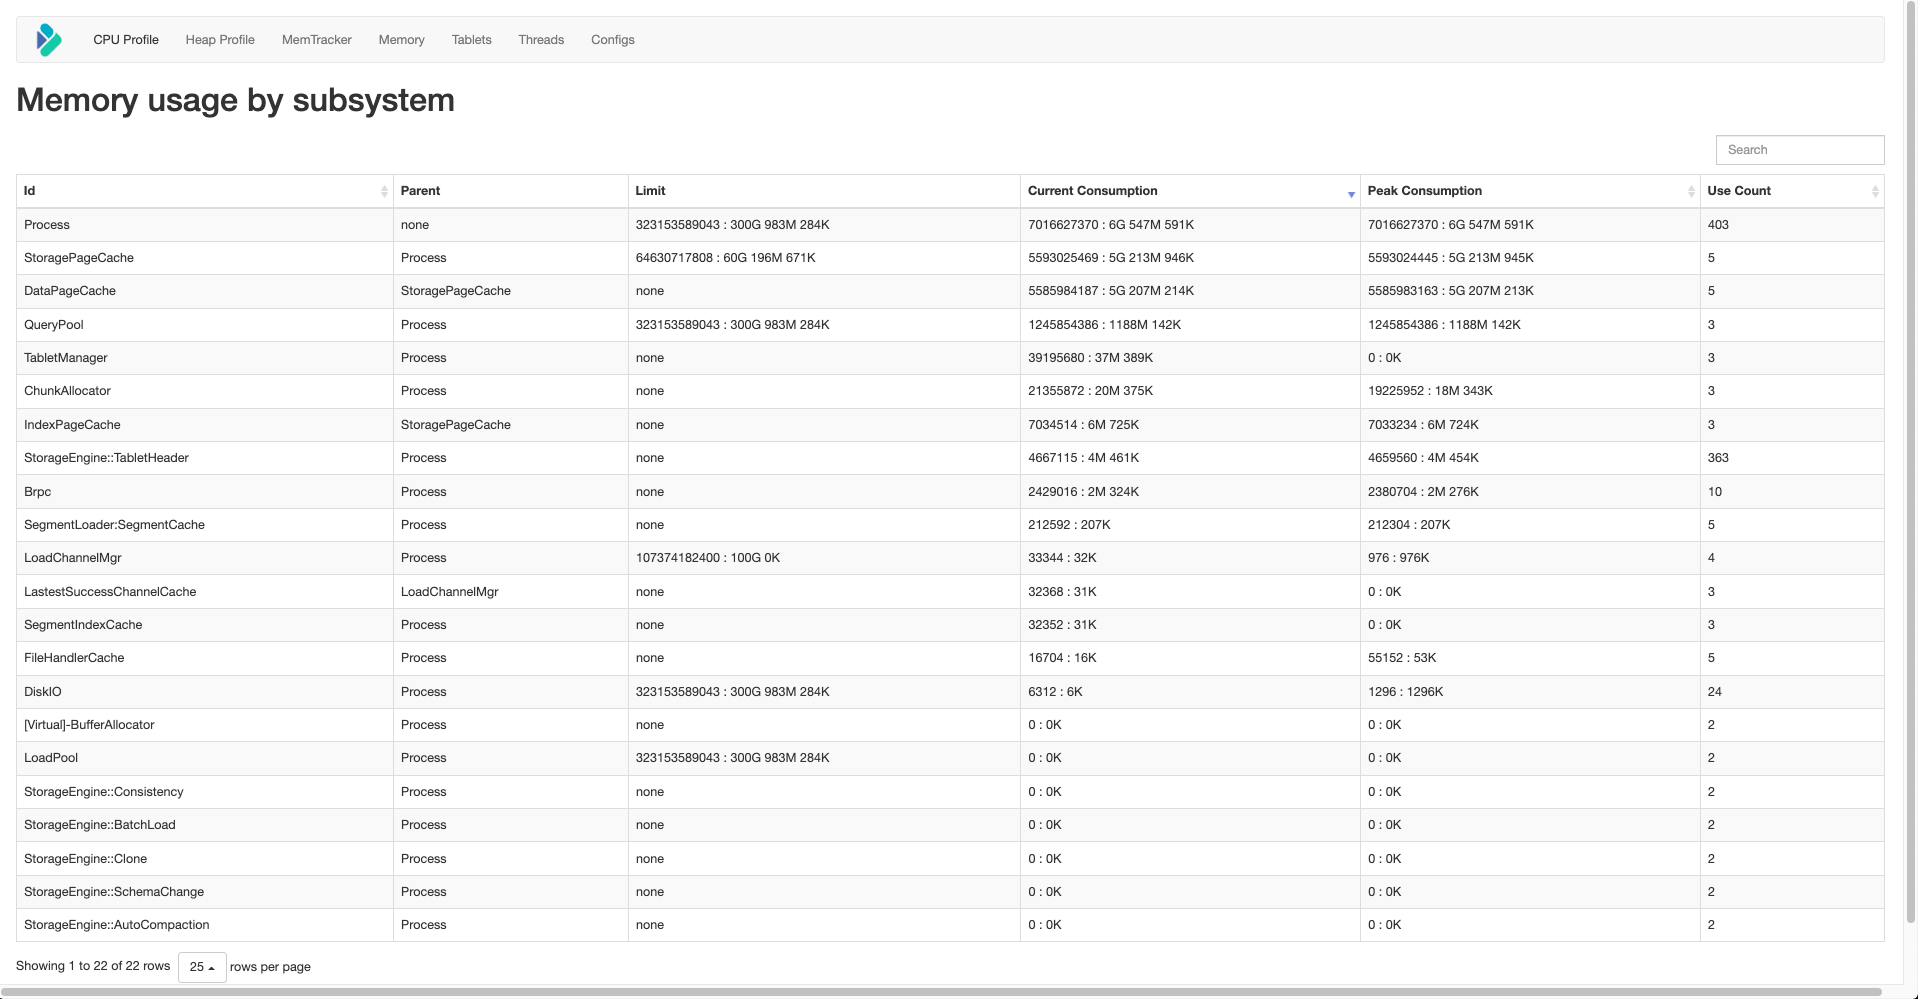 > query done  2. mem_tracker_level=1 (TASK) > query ing  3. mem_tracker_level=2 (INSTANCE) > query ing  5. mem_tracker_level=3 (VERBOSE) > query ing     > query done  > query ing, set parallel_fragment_exec_instance_num=10; ``` ERROR 1105 (HY000): errCode = 2, detailMessage = Memory limit exceeded: Memory exceed limit. fragment=, details=In TCMalloc Hook, aggregator, while execute get_next., on backend=10.81.85.89. Memory left in process limit=293.08 GB. failed alloc=<Memory limit exceeded: label=queryId=5e72ea753ed5438b-89adf8b2a56f6bf1 TryConsume failed size=4096, used=2147853311, limit=2147483648>. current tracker=ExecNode:VAGGREGATION_NODE (id=7). If this is a query, can change the limit by session variable exec_mem_limit. ``` > query ing, set parallel_fragment_exec_instance_num=10, set exec_mem_limit= 21474836480;  -- This is an automated message from the Apache Git Service. To respond to the message, please log on to GitHub and use the URL above to go to the specific comment. To unsubscribe, e-mail: commits-unsubscr...@doris.apache.org For queries about this service, please contact Infrastructure at: us...@infra.apache.org --------------------------------------------------------------------- To unsubscribe, e-mail: commits-unsubscr...@doris.apache.org For additional commands, e-mail: commits-h...@doris.apache.org