Hi,
You should give a minimal reproducible example so that we know more
precisely what you want to do (what's a "multigraph"?).
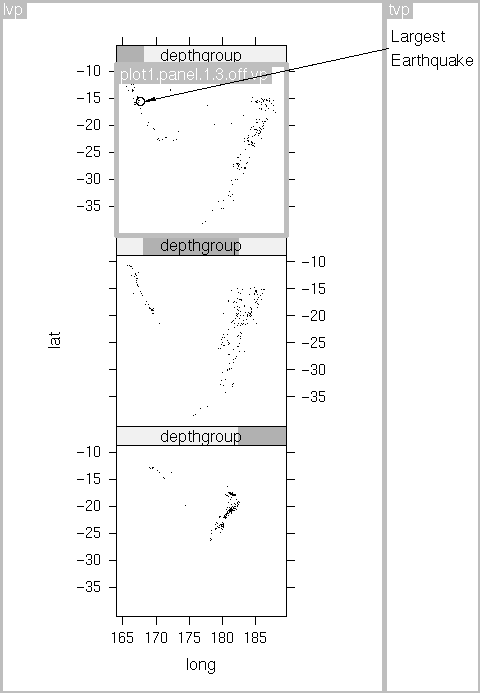
Perhaps you can get inspiration from Paul Murrell's R graphics book,
in particular Figure 5.22,
http://www.stat.auckland.ac.nz/~paul/RGraphics/customgrid-latticeingrid.png
But that requires using Grid graphics as opposed to base graphics.
Perhaps the gridBase package can help in this regard.
Hope this helps,

baptiste


On 16 Apr 2009, at 11:57, rajesh j wrote:
Hi,
I need to draw a line segment between two points on different plots
in the
same multigraph.I've tried looking at the zoominplot function in
plotrix but
havent understood much.any help is appreciated

~Aks

        [[alternative HTML version deleted]]

______________________________________________
[email protected] mailing list
https://stat.ethz.ch/mailman/listinfo/r-help
PLEASE do read the posting guide http://www.R-project.org/posting-guide.html
and provide commented, minimal, self-contained, reproducible code.
_____________________________

Baptiste Auguié

School of Physics
University of Exeter
Stocker Road,
Exeter, Devon,
EX4 4QL, UK

Phone: +44 1392 264187

http://newton.ex.ac.uk/research/emag

______________________________________________
[email protected] mailing list
https://stat.ethz.ch/mailman/listinfo/r-help
PLEASE do read the posting guide http://www.R-project.org/posting-guide.html
and provide commented, minimal, self-contained, reproducible code.