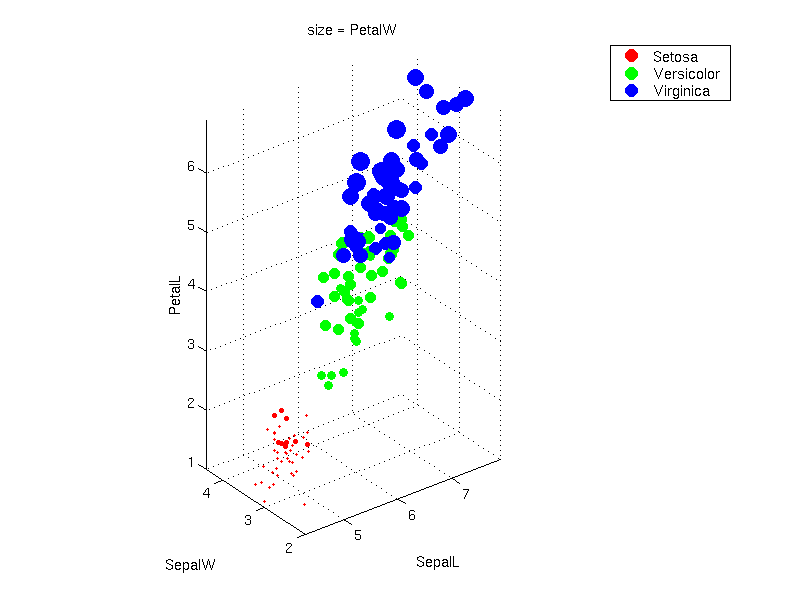
Hello all,
I'm using the cloud function to plot the iris data as per the document:
http://www.stat.ucl.ac.be/ISpersonnel/lecoutre/stats/fichiers/_gallery.pdf
I'd like to change the point size to reflect a fourth variable, as done here
http://www.cis.hut.fi/projects/somtoolbox/download/pics2/shotvs2_origdata.png

Does anybody know how to do this? There doesn't seem to be an option in
cloud()

Thanks,
Richie

        [[alternative HTML version deleted]]

______________________________________________
R-help@r-project.org mailing list
https://stat.ethz.ch/mailman/listinfo/r-help
PLEASE do read the posting guide http://www.R-project.org/posting-guide.html
and provide commented, minimal, self-contained, reproducible code.