Hi there,

I try to plot visible light spectrum (380nm~780nm) with color
corresponding to the specific wavelength. However, I don't find a
function that could do this.
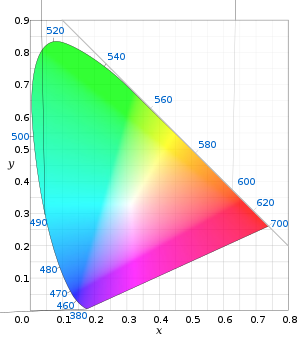
Another question, it's possible to plot a color space chromaticity
diagram like this:
http://upload.wikimedia.org/wikipedia/commons/thumb/0/02/CIExy1931.svg/300px-CIExy1931.svg.png

Thanks in advance!

Jinsong

______________________________________________
R-help@r-project.org mailing list
https://stat.ethz.ch/mailman/listinfo/r-help
PLEASE do read the posting guide http://www.R-project.org/posting-guide.html
and provide commented, minimal, self-contained, reproducible code.