hi,
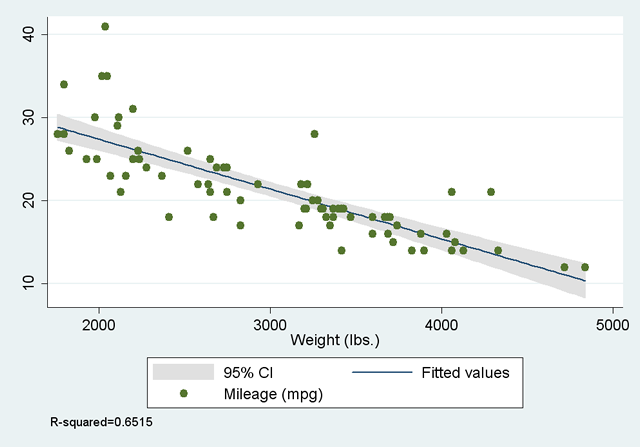
is there an easy way to plot the "confidence lines" or "confidence area" of the beta weight in a scatterplot?
like in this plot;
http://www.ssc.wisc.edu/sscc/pubs/screenshots/4-25/4-25_4.png


thanks!

______________________________________________
R-help@r-project.org mailing list
https://stat.ethz.ch/mailman/listinfo/r-help
PLEASE do read the posting guide http://www.R-project.org/posting-guide.html
and provide commented, minimal, self-contained, reproducible code.