Neil Shephard wrote:
Jinsong Zhao wrote:
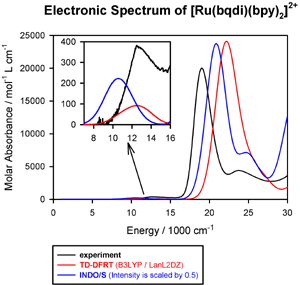
Hi there,

I hope to draw a plot like this:
http://www.sg-chem.net/swizard/Ru-bqdi-spectra.gif

is it possible to draw it using R?

thanks for any suggestions.
My intuition would say yes it is possible as R graphics are highly flexible.

I'm afraid I don't know how though, but the following may be useful
resources in working out the code...

R Graphics Gallery (including sample code):
http://addictedtor.free.fr/graphiques/

R Graphics by Paul Murrell (web-site to accompany book, which you have to
buy) : http://www.stat.auckland.ac.nz/~paul/RGraphics/rgraphics.html

Another R Graphics Gallery : http://research.stowers-institute.org/efg/R/

A number of links in the R wiki to graphics resources :
http://wiki.r-project.org/rwiki/doku.php?id=links:links

...in particular the following site which contains ~8000 graph examples
(again including example code) :http://bm2.genes.nig.ac.jp/RGM2/index.php


Neil
Thank you very much for your information. I have try to draw it with
dirty tricks, something like:
# first plot the large plot
op <- par()
par(mar = c(15, 6, 6, 15) + 0.1)
par(new = TRUE)
# the plot the small one
par(op)

In the last step, it give some warnings:
1: In par(op) : graphical parameter "cin" cannot be set
2: In par(op) : graphical parameter "cra" cannot be set
3: In par(op) : graphical parameter "csi" cannot be set
4: In par(op) : graphical parameter "cxy" cannot be set
5: In par(op) : graphical parameter "din" cannot be set

however, it seems that it dose not affect the results.

Thanks again,
Jinsong

______________________________________________
R-help@r-project.org mailing list
https://stat.ethz.ch/mailman/listinfo/r-help
PLEASE do read the posting guide http://www.R-project.org/posting-guide.html
and provide commented, minimal, self-contained, reproducible code.