I may be confused, but this seems ill-defined since, in the example,
the color corresponds to a numerical value: characters are only there
as labels. Do you intend to map the characters onto some numerical
spectrum? If so, how?
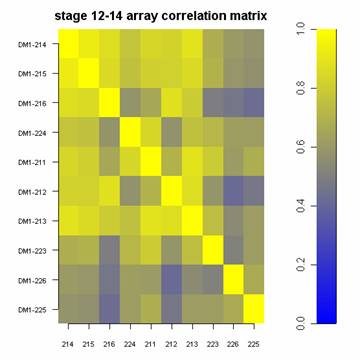
As a side note, one of the best places to get visualization ideas in
my experience has been the R Graph Gallery. It's often worth a look
and comes with code examples for all the entries: perhaps you can find
some attempts at "graphing" character data there.

Michael

On Wed, Dec 14, 2011 at 11:30 AM, Ana <rrast...@gmail.com> wrote:
> Hi, I am looking for options to plot the following type of matrices:
>
> "A" "B" "C" "D"
> "A" "A" "C" "C"
> "A" "A" "A" "C"
>
> as a image like this: http://www.phaget4.org/R/image002.jpg
>
> ______________________________________________
> R-help@r-project.org mailing list
> https://stat.ethz.ch/mailman/listinfo/r-help
> PLEASE do read the posting guide http://www.R-project.org/posting-guide.html
> and provide commented, minimal, self-contained, reproducible code.

______________________________________________
R-help@r-project.org mailing list
https://stat.ethz.ch/mailman/listinfo/r-help
PLEASE do read the posting guide http://www.R-project.org/posting-guide.html
and provide commented, minimal, self-contained, reproducible code.