On Sep 16, 2010, at 9:04 PM, wns09a wrote:
Basically, I have the location data for about 1,000 pitches. I can
get them
to show up correctly on normal plots, but I am genuinely messed up on
heatmaps.
location <- read.csv('C:/Users/William/Downloads/09Location.csv')
location <- as.matrix(location)
Like I said, that can get a plot fine.
You may think that you attached a file and that we can see it. The
first may be true, but the second is FALSE. You probably want a 2D
density estimator. Try searching rseek or RSiteSearch for "2d density".
Should I use image or heatmap?
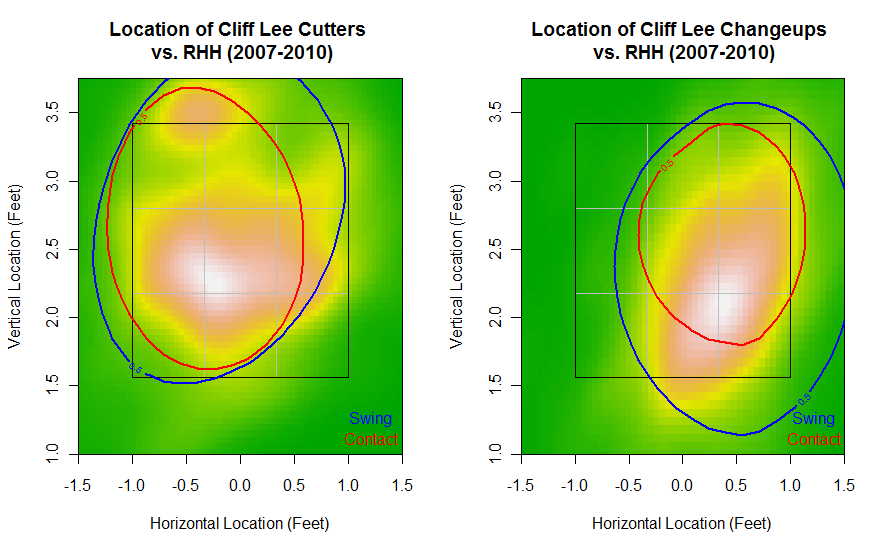
For the record, I want something like
this:http://2.bp.blogspot.com/_hZYdwHvvD9U/THo_YaK0dGI/AAAAAAAAAgg/VjzVngS2-BU/s1600/clifflee3.png
I don't need the contour lines, though.
--
View this message in context:
http://r.789695.n4.nabble.com/Making-heatmaps-tp2543201p2543201.html
Sent from the R help mailing list archive at Nabble.com.
Please read the Posting Guide.
#----------
PLEASE do read the posting guide http://www.R-project.org/posting-guide.html
#----------
and provide commented, minimal, self-contained, reproducible code.
David Winsemius, MD
West Hartford, CT

______________________________________________
R-help@r-project.org mailing list
https://stat.ethz.ch/mailman/listinfo/r-help
PLEASE do read the posting guide http://www.R-project.org/posting-guide.html
and provide commented, minimal, self-contained, reproducible code.