I'll check out those functions, thanks much for the help.

On Wed, Sep 1, 2010 at 8:38 PM, Ben Bolker <bbol...@gmail.com> wrote:
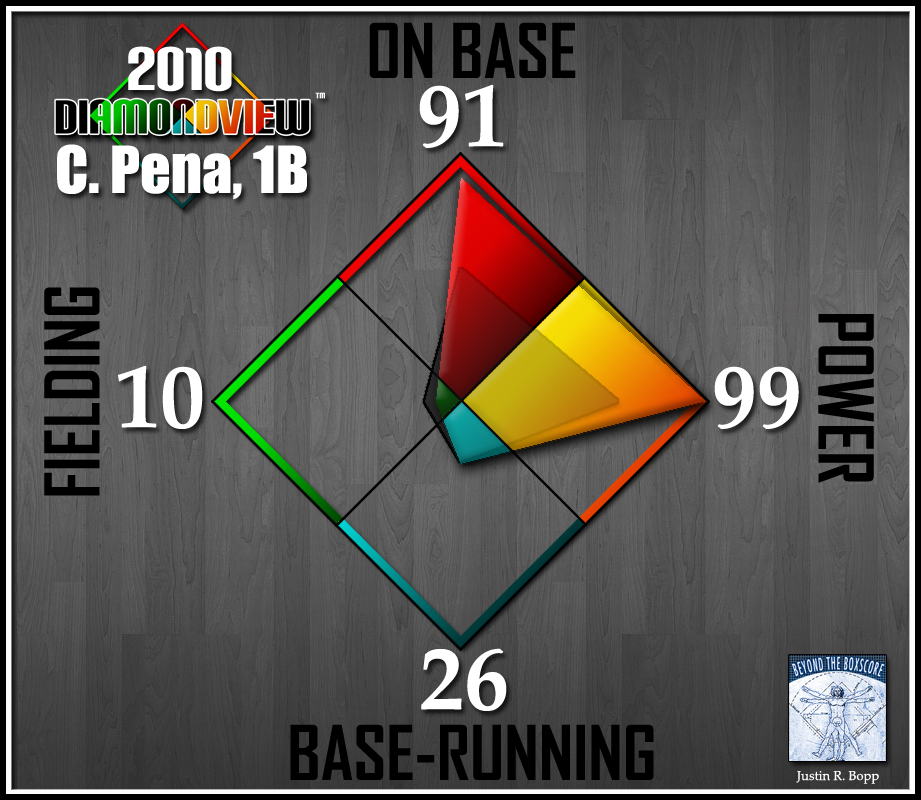
> David Winsemius <dwinsemius <at> comcast.net> writes:
>
> >
> >
> > On Sep 1, 2010, at 7:50 PM, John K. Williams wrote:
> >
> > > Hi, does anyone have any idea how I might make a plot in R similar
> > > to this:
> > > http://assets.sbnation.com/assets/272612/BATTER-1B-PENA.png
> > >
> > > Specifically looking to plot 3 numbers in a triangle like that.
> > >
> >
> > Well, not exactly what you requested but you've got to admit that was
> > one gawdawful graph::
> >
> > http://addictedtor.free.fr/graphiques/RGraphGallery.php?graph=96
> >
>
>
>  I have to agree that these graphs are awfully hard to read
> <
> http://www.beyondtheboxscore.com/2010/1/16/1253520/introducing-diamondview-2-010
> >
>
> The examples in the original
> <
> http://www.beyondtheboxscore.com/2009/9/16/1032763/introducing-diamondview-composite
> >
> make it easier to see how this is actually defined.
>
>  This is of course _possible_ in R ('just' compute the vertices of
> the polygons you want to draw and use polygon() to add them to a plot
> created with type="n"), but it could be some work.  It's conceivable
> that you could hack stars() to do what you want.
>
> ______________________________________________
> R-help@r-project.org mailing list
> https://stat.ethz.ch/mailman/listinfo/r-help
> PLEASE do read the posting guide
> http://www.R-project.org/posting-guide.html
> and provide commented, minimal, self-contained, reproducible code.
>

        [[alternative HTML version deleted]]

______________________________________________
R-help@r-project.org mailing list
https://stat.ethz.ch/mailman/listinfo/r-help
PLEASE do read the posting guide http://www.R-project.org/posting-guide.html
and provide commented, minimal, self-contained, reproducible code.