Hi Neo,

First, you will happy to know that the next release (coming out real soon
now) will have some significant performance improvements as well as an
option to draw asynchronously, which will greatly improve the interactivity
of the ChartRangeFilter with a large amount of data.
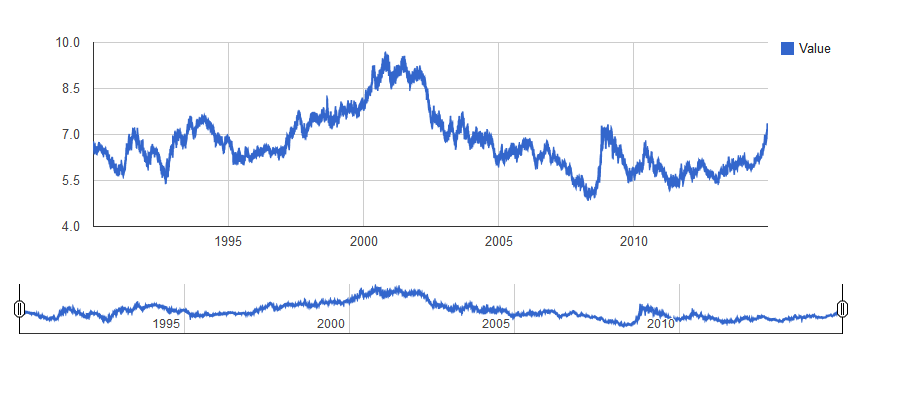
Constructing your data using several addRow() calls is slower than if you
can give it an array of all the data at one time, using arrayToDataTable()
or the JSON representation.

I can't tell what might be happening with your 'state' property, but I
would check on the format of the values in your 'from_date' and 'to_date'
in comparison with all the other date values in your data, which you
convert in the same way.  Is it not working for you even with a small
amount of data?

On Mon, Dec 15, 2014 at 5:41 AM, <[email protected]> wrote:
>
> Hello all,
>
> I have come here after all most 7 days of research and after no returns in
> what i need from Google Chart,
>
> 1. I am trying to create Line graph using huge json dataset of currency
> for last 10 years(approx)
> this is the json file I am using -
> https://www.quandl.com/api/v1/datasets/BNP/USDNOK.json
>
> The first issue I faced was loading the json data into the chart api to
> display graph, I hit a succes after 3 days
>
> http://devserver.swsdreams.com/client/dibl/lab/ - the load time was
> terrible - 15.36 sec improved to 7.5 sec, but still needs to improve since
> I will be comparing 160+ currency and plotting graph for them.
>
> 2. The chartrangefilter is very confusing - I am just not able to get it
> positioned for recent 12 months of data (Dec 2013 to Dec 2104)
>
> Any help or direction to solve this problem will be very helpful.
>
> Here is my Index.php file -
>
>
> <!DOCTYPE html PUBLIC "-//W3C//DTD XHTML 1.0 Strict//EN" "
> http://www.w3.org/TR/xhtml1/DTD/xhtml1-strict.dtd";>
> <html xmlns="http://www.w3.org/1999/xhtml";>
>   <head>
>     <meta content="text/html;charset=utf-8" http-equiv="Content-Type">
>     <meta content="utf-8" http-equiv="encoding">
>     <title>
>       Google Visualization API Sample
>     </title>
>
>      <script type="text/javascript"
>         src='https://www.google.com/jsapi?autoload={
> "modules":[{"name":"visualization","version":"1","packages":["corechart","controls"]}]}'
> >
>      </script>
>
>     <script type="text/javascript" src="jquery.min.js"></script>
>     <script type="text/javascript">
>
>     //google.load('visualization', '1.1', {packages: ['corechart',
> 'controls']});
>
>     </script>
>     <script type="text/javascript">
>
>       function drawVisualization() {
>
>         var jsonData = $.ajax({
>               url: "getData.php",
>               dataType:"json",
>               async: false
>               }).responseText;
>
>         //console.log('after ajax: '+($.now()-nowTime));
>
>         //alert(jsonData);
>         var    jsonData2=$.parseJSON(jsonData);
>         //console.log(jsonData2);
>
>         var dashboard = new google.visualization.Dashboard(document.
> getElementById('dashboard'));
>
>          debugger;
>
>         var currentDate2 = jsonData2['from_date'];
>         //var tempDate2 = currentDate2.split("-");
>         var convDate2 = new Date(currentDate2);
>
>         currentDate2 = jsonData2['to_date'];
>         //tempDate2 = currentDate2.split("-");
>         var convDate3 = new Date(currentDate2);
>
>         var control = new google.visualization.ControlWrapper({
>            'controlType': 'ChartRangeFilter',
>            'containerId': 'control',
>            'options': {
>             'title': jsonData2['name'],
>              // Filter by the date axis.
>              'filterColumnIndex': 0,
>              'ui': {
>                'chartType': 'LineChart',
>                'chartOptions': {
>                  'chartArea': {'width': '90%'},
>                  'hAxis': {'baselineColor': 'none'}
>                },
>                // Display a single series that shows the closing value of
> the stock.
>                // Thus, this view has two columns: the date (axis) and
> the stock value (line series).
>                'chartView': {
>                  'columns': [0, 1]
>                },
>                // 1 day in milliseconds = 24 * 60 * 60 * 1000 = 86,400,000
>                'minRangeSize': 86400000
>              }
>            },
>            // Initial range: 2012-02-09 to 2012-03-20.
>            'state': {'range': {'start': convDate2, 'end': convDate3}}
>          });
>
>       debugger;
>
>         //var chart = new
> google.visualization.LineChart(document.getElementById('chart_div'));
>          var chart = new google.visualization.ChartWrapper({
>            'chartType': 'LineChart',
>            'containerId': 'chart_div'
>          });
>
>         debugger;
>
>          var data = new google.visualization.DataTable();
>
>          data.addColumn('date', 'Date');
>           data.addColumn('number', 'Value');
>
>         //alert(jsonData2['data'].length);
>         //data.addRows(jsonData2['data']);
>
>
>          for (var i = 0; i < (jsonData2['data'].length); i++) {
>
>             var currentDate = jsonData2['data'][i][0];
>             var currentValue = jsonData2['data'][i][1];
>
>             //var tempDate = currentDate.split("-");
>             var convDate = new Date(currentDate);
>             // new Date(2012, 0 ,day);
>             //alert(currentDate);
>             //alert(currentValue);
>
>            //data.addRow([convDate, Math.round(currentValue)]);
>            data.addRow([convDate, currentValue]);
>          }
>
>          dashboard.bind(control, chart);
>          dashboard.draw(data);
>       }
>
>         google.setOnLoadCallback(drawVisualization);
>     </script>
>   </head>
>   <body>
>     <div id="dashboard">
>         <div id="chart_div" style='width: 915px; height: 300px;'></div>
>         <div id="control" style='width: 915px; height: 50px;'></div>
>     </div>
>   </body>
> </html>
>
>
>
>
>
> <https://lh5.googleusercontent.com/-osekM_ApfvY/VI66A0cDHcI/AAAAAAAAAAM/kv1AXmKr8Rc/s1600/Google%2BVisualization%2BAPI%2BSample%2B2014-12-15%2B16-06-47.png>
>
>  --
> You received this message because you are subscribed to the Google Groups
> "Google Chart API" group.
> To unsubscribe from this group and stop receiving emails from it, send an
> email to [email protected].
> To post to this group, send email to [email protected].
> Visit this group at http://groups.google.com/group/google-chart-api.
> For more options, visit https://groups.google.com/d/optout.
>


--
Daniel LaLiberte <https://plus.google.com/100631381223468223275?prsrc=2>  -
978-394-1058
[email protected] <[email protected]>   5CC, Cambridge MA
[email protected] <[email protected]> 9 Juniper Ridge
Road, Acton MA

--
You received this message because you are subscribed to the Google Groups
"Google Chart API" group.
To unsubscribe from this group and stop receiving emails from it, send an email
to [email protected].
To post to this group, send email to [email protected].
Visit this group at http://groups.google.com/group/google-chart-api.
For more options, visit https://groups.google.com/d/optout.