This is an automated email from the ASF dual-hosted git repository.

zjffdu pushed a commit to branch master
in repository https://gitbox.apache.org/repos/asf/zeppelin.git
The following commit(s) were added to refs/heads/master by this push:
new 470ba45 [ZEPPELIN-5383] add an example to the doc how to output
plotly graphs
470ba45 is described below
commit 470ba4533930f2eec1770d491a2fe34fbb2f3c47
Author: Jeff Zhang <zjf...@apache.org>
AuthorDate: Sun Aug 1 13:33:46 2021 +0800
[ZEPPELIN-5383] add an example to the doc how to output plotly graphs
### What is this PR for?
Add plotly example in python tutuorial note and also add plotly in zeppelin
docker image so that user can play that in official zeppelin image.
### What type of PR is it?
[ Documentation ]
### Todos
* [ ] - Task
### What is the Jira issue?
* https://issues.apache.org/jira/browse/ZEPPELIN-5383
### How should this be tested?
* Manually tested
### Screenshots (if appropriate)
### Questions:
* Does the licenses files need update? No
* Is there breaking changes for older versions? No
* Does this needs documentation? No
Author: Jeff Zhang <zjf...@apache.org>
Closes #4194 from zjffdu/ZEPPELIN-5383 and squashes the following commits:
e93322dd61 [Jeff Zhang] [ZEPPELIN-5383] add an example to the doc how to
output plotly graphs
---
.... IPython Visualization Tutorial_2F1S9ZY8Z.zpln | 109 +++++++++++++++++----
.../docker/zeppelin/bin/env_python_3_with_R.yml | 1 +
2 files changed, 89 insertions(+), 21 deletions(-)
diff --git a/notebook/Python Tutorial/2. IPython Visualization
Tutorial_2F1S9ZY8Z.zpln b/notebook/Python Tutorial/2. IPython Visualization
Tutorial_2F1S9ZY8Z.zpln
index 3d2a821..43f4249 100644
--- a/notebook/Python Tutorial/2. IPython Visualization Tutorial_2F1S9ZY8Z.zpln
+++ b/notebook/Python Tutorial/2. IPython Visualization Tutorial_2F1S9ZY8Z.zpln
@@ -2,19 +2,20 @@
"paragraphs": [
{
"title": "Overview",
- "text": "%md\n\n\nThere\u0027re many visualization libraries availabel
in python world. Visualization is tremendous useful in notebook enviroment,
most of them could be used in Jupyter Notebook. And most of them can also be
used in Apache Zeppelin Notebook, but maybe a little difference for some
libraries. This tutorial will teach you how to use these popular visualization
libraries in Apache Zeppelin. To be noted, you need to use IPython interpreter
to make these libraries work in [...]
+ "text": "%md\n\n\nThere\u0027re many visualization libraries availabel
in python world. Visualization is tremendous useful in notebook enviroment,
most of them could be used in Jupyter Notebook. And most of them can also be
used in Apache Zeppelin Notebook, but maybe a little difference for some
libraries. This tutorial will teach you how to use these popular visualization
libraries in Apache Zeppelin. To be noted, you need to use IPython interpreter
to make these libraries work in [...]
"user": "anonymous",
- "dateUpdated": "2021-07-26 03:16:09.053",
+ "dateUpdated": "2021-08-01 05:30:04.562",
"progress": 0,
"config": {
"tableHide": false,
"editorSetting": {
- "language": "text",
- "editOnDblClick": false,
- "completionKey": "TAB"
+ "language": "markdown",
+ "editOnDblClick": true,
+ "completionKey": "TAB",
+ "completionSupport": false
},
"colWidth": 12.0,
- "editorMode": "ace/mode/text",
+ "editorMode": "ace/mode/markdown",
"fontSize": 9.0,
"editorHide": true,
"results": {},
@@ -30,7 +31,7 @@
"msg": [
{
"type": "HTML",
- "data": "\u003cdiv
class\u003d\"markdown-body\"\u003e\n\u003cp\u003eThere\u0026rsquo;re many
visualization libraries availabel in python world. Visualization is tremendous
useful in notebook enviroment, most of them could be used in Jupyter Notebook.
And most of them can also be used in Apache Zeppelin Notebook, but maybe a
little difference for some libraries. This tutorial will teach you how to use
these popular visualization libraries in Apache Zeppelin. To be noted, you n
[...]
+ "data": "\u003cdiv
class\u003d\"markdown-body\"\u003e\n\u003cp\u003eThere\u0026rsquo;re many
visualization libraries availabel in python world. Visualization is tremendous
useful in notebook enviroment, most of them could be used in Jupyter Notebook.
And most of them can also be used in Apache Zeppelin Notebook, but maybe a
little difference for some libraries. This tutorial will teach you how to use
these popular visualization libraries in Apache Zeppelin. To be noted, you n
[...]
}
]
},
@@ -40,8 +41,8 @@
"jobName": "paragraph_1580884482808_420748092",
"id": "20180117-220147_1889980489",
"dateCreated": "2020-02-05 14:34:42.808",
- "dateStarted": "2021-07-26 03:16:09.083",
- "dateFinished": "2021-07-26 03:16:09.090",
+ "dateStarted": "2021-08-01 05:30:04.570",
+ "dateFinished": "2021-08-01 05:30:06.944",
"status": "FINISHED"
},
{
@@ -1122,9 +1123,10 @@
"status": "FINISHED"
},
{
- "text": "%python.ipython\n",
+ "title": "Plotly",
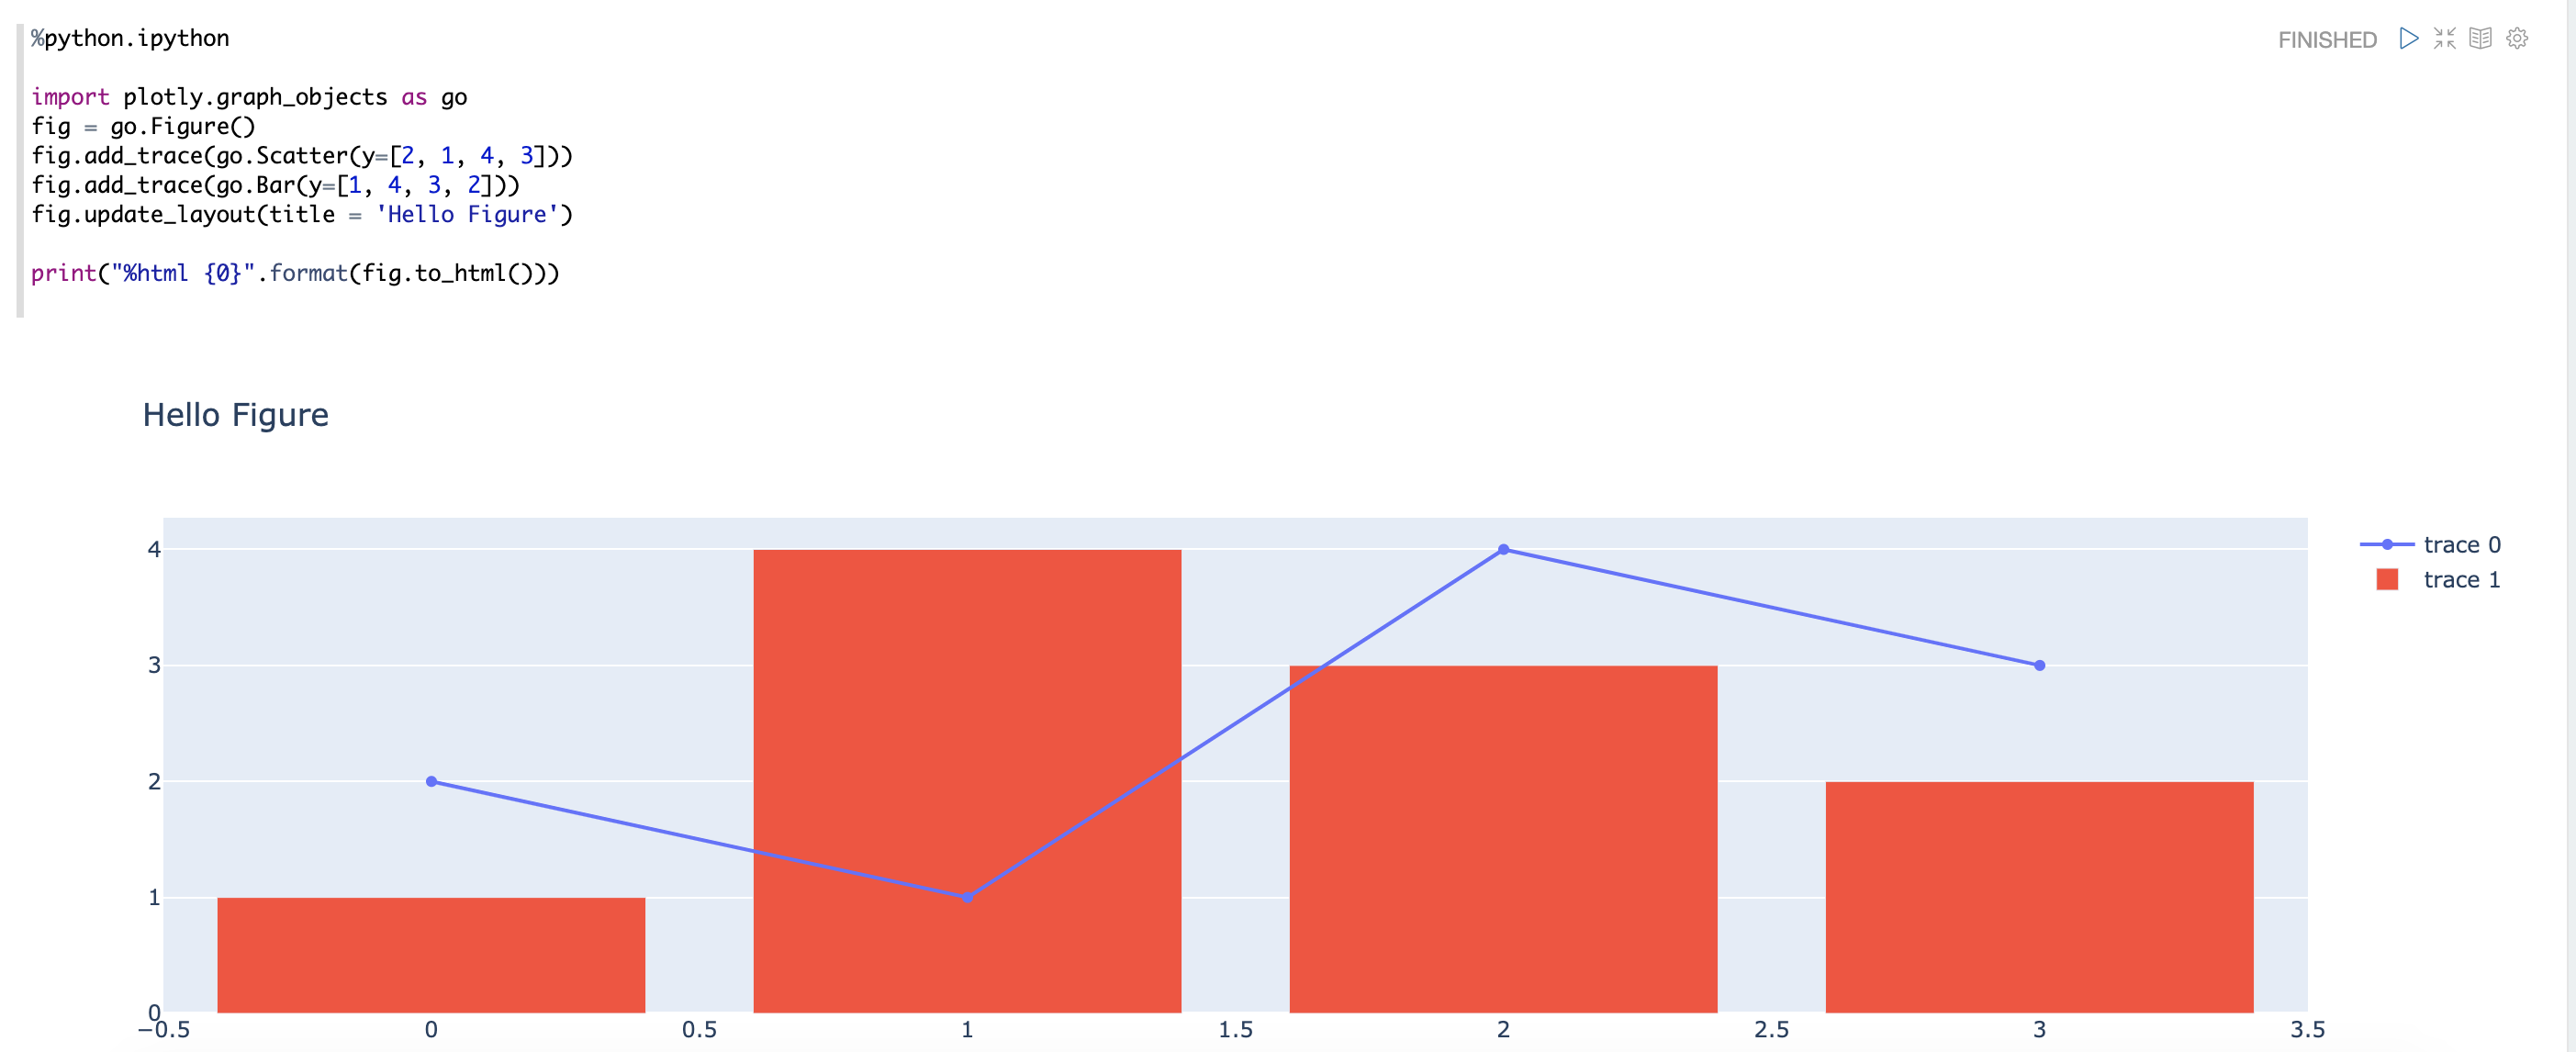
+ "text": "%md\n\n[plotly.py](https://plotly.com/python/) is an
interactive, open-source, and browser-based graphing library for Python\n",
"user": "anonymous",
- "dateUpdated": "2021-07-26 03:16:21.426",
+ "dateUpdated": "2021-08-01 05:31:06.316",
"progress": 0,
"config": {
"colWidth": 12.0,
@@ -1132,12 +1134,15 @@
"enabled": true,
"results": {},
"editorSetting": {
- "language": "python",
- "editOnDblClick": false,
+ "language": "markdown",
+ "editOnDblClick": true,
"completionKey": "TAB",
- "completionSupport": true
+ "completionSupport": false
},
- "editorMode": "ace/mode/python"
+ "editorMode": "ace/mode/markdown",
+ "title": true,
+ "editorHide": true,
+ "tableHide": false
},
"settings": {
"params": {},
@@ -1145,7 +1150,12 @@
},
"results": {
"code": "SUCCESS",
- "msg": []
+ "msg": [
+ {
+ "type": "HTML",
+ "data": "\u003cdiv
class\u003d\"markdown-body\"\u003e\n\u003cp\u003e\u003ca
href\u003d\"https://plotly.com/python/\"\u003eplotly.py\u003c/a\u003e is an
interactive, open-source, and browser-based graphing library for
Python\u003c/p\u003e\n\n\u003c/div\u003e"
+ }
+ ]
},
"apps": [],
"runtimeInfos": {},
@@ -1153,9 +1163,68 @@
"jobName": "paragraph_1580886440097_1853064047",
"id": "paragraph_1580886440097_1853064047",
"dateCreated": "2020-02-05 15:07:20.097",
- "dateStarted": "2021-07-26 03:16:21.446",
- "dateFinished": "2021-07-26 03:16:21.501",
+ "dateStarted": "2021-08-01 05:31:06.314",
+ "dateFinished": "2021-08-01 05:31:06.341",
+ "status": "FINISHED"
+ },
+ {
+ "text": "%python.ipython\n\nimport plotly.graph_objects as go\nfig
\u003d go.Figure()\nfig.add_trace(go.Scatter(y\u003d[2, 1, 4,
3]))\nfig.add_trace(go.Bar(y\u003d[1, 4, 3, 2]))\nfig.update_layout(title
\u003d \u0027Hello Figure\u0027)\n\nprint(\"%html
{0}\".format(fig.to_html()))\n",
+ "user": "anonymous",
+ "dateUpdated": "2021-08-01 05:31:26.498",
+ "progress": 0,
+ "config": {
+ "editorSetting": {
+ "language": "python",
+ "editOnDblClick": false,
+ "completionKey": "TAB",
+ "completionSupport": true
+ },
+ "colWidth": 12.0,
+ "editorMode": "ace/mode/python",
+ "fontSize": 9.0,
+ "results": {},
+ "enabled": true
+ },
+ "settings": {
+ "params": {},
+ "forms": {}
+ },
+ "results": {
+ "code": "SUCCESS",
+ "msg": [
+ {
+ "type": "HTML",
+ "data": "\u003chtml\u003e\n\u003chead\u003e\u003cmeta
charset\u003d\"utf-8\" /\u003e\u003c/head\u003e\n\u003cbody\u003e\n
\u003cdiv\u003e \u003cscript
type\u003d\"text/javascript\"\u003ewindow.PlotlyConfig \u003d {MathJaxConfig:
\u0027local\u0027};\u003c/script\u003e\n \u003cscript
type\u003d\"text/javascript\"\u003e/**\n* plotly.js v2.2.0\n* Copyright
2012-2021, Plotly, Inc.\n* All rights reserved.\n* Licensed under the MIT
license\n*/\n!func [...]
+ }
+ ]
+ },
+ "apps": [],
+ "runtimeInfos": {},
+ "progressUpdateIntervalMs": 500,
+ "jobName": "paragraph_1627795866313_860474115",
+ "id": "paragraph_1627795866313_860474115",
+ "dateCreated": "2021-08-01 05:31:06.313",
+ "dateStarted": "2021-08-01 05:31:26.520",
+ "dateFinished": "2021-08-01 05:31:32.941",
"status": "FINISHED"
+ },
+ {
+ "text": "%python.ipython\n",
+ "user": "anonymous",
+ "dateUpdated": "2021-08-01 05:31:26.520",
+ "progress": 0,
+ "config": {},
+ "settings": {
+ "params": {},
+ "forms": {}
+ },
+ "apps": [],
+ "runtimeInfos": {},
+ "progressUpdateIntervalMs": 500,
+ "jobName": "paragraph_1627795886520_751874539",
+ "id": "paragraph_1627795886520_751874539",
+ "dateCreated": "2021-08-01 05:31:26.520",
+ "status": "READY"
}
],
"name": "2. IPython Visualization Tutorial",
@@ -1168,7 +1237,5 @@
"config": {
"isZeppelinNotebookCronEnable": false
},
- "info": {
- "isRunning": true
- }
+ "info": {}
}
\ No newline at end of file
diff --git a/scripts/docker/zeppelin/bin/env_python_3_with_R.yml
b/scripts/docker/zeppelin/bin/env_python_3_with_R.yml
index ac14390..26d7775 100644
--- a/scripts/docker/zeppelin/bin/env_python_3_with_R.yml
+++ b/scripts/docker/zeppelin/bin/env_python_3_with_R.yml
@@ -21,6 +21,7 @@ dependencies:
- intake-xarray
- altair
- vega_datasets
+ - plotly
- pip
- r-base=3
- r-data.table