tdunning edited a comment on pull request #7069:
URL: https://github.com/apache/incubator-pinot/pull/7069#issuecomment-863828785
I have done an analysis here. I believe that the root of the issue is that the t-digest takes the compression factor more seriously now than it did before. That means that there will typically be 27 ± 5 centroids in a digest with compression factor 50. In the failure that I analyzed, there were 42 data points across 23 centroids. The issue observed has several contributory factors: a) the requirement that values differ by no more than 5 percent is very optimistic when one digest interpolates and the other doesn't. This will happen differently according to just which points get collected together and can easily differ, particularly right on the border between centroids of weight 1 and 2. It should be noted that substantially over 1% of all consecutive samples of groups of 40 uniformly distributed variates will be separated by more than 10% which means that interpolation is very likely to cause this error. b) the interpretation of compression parameter for 3.3 is more strict resulting in somewhat smaller digest than before. c) the compression value for the t-digest is smaller than typical (50 instead of 100 or 200). d) the quantile chosen interacted with the number of samples to force interpolation to almost as bad a result as possible. The summary of this is that the t-digest appears to be functioning correctly and this test is a bit too aggressive. The likely best remedy is to increase the compression value used to 100. Increasing default compression for t-digests across the board should be considered as well. ## Detailed analysis The general situation is as shown in this figure: 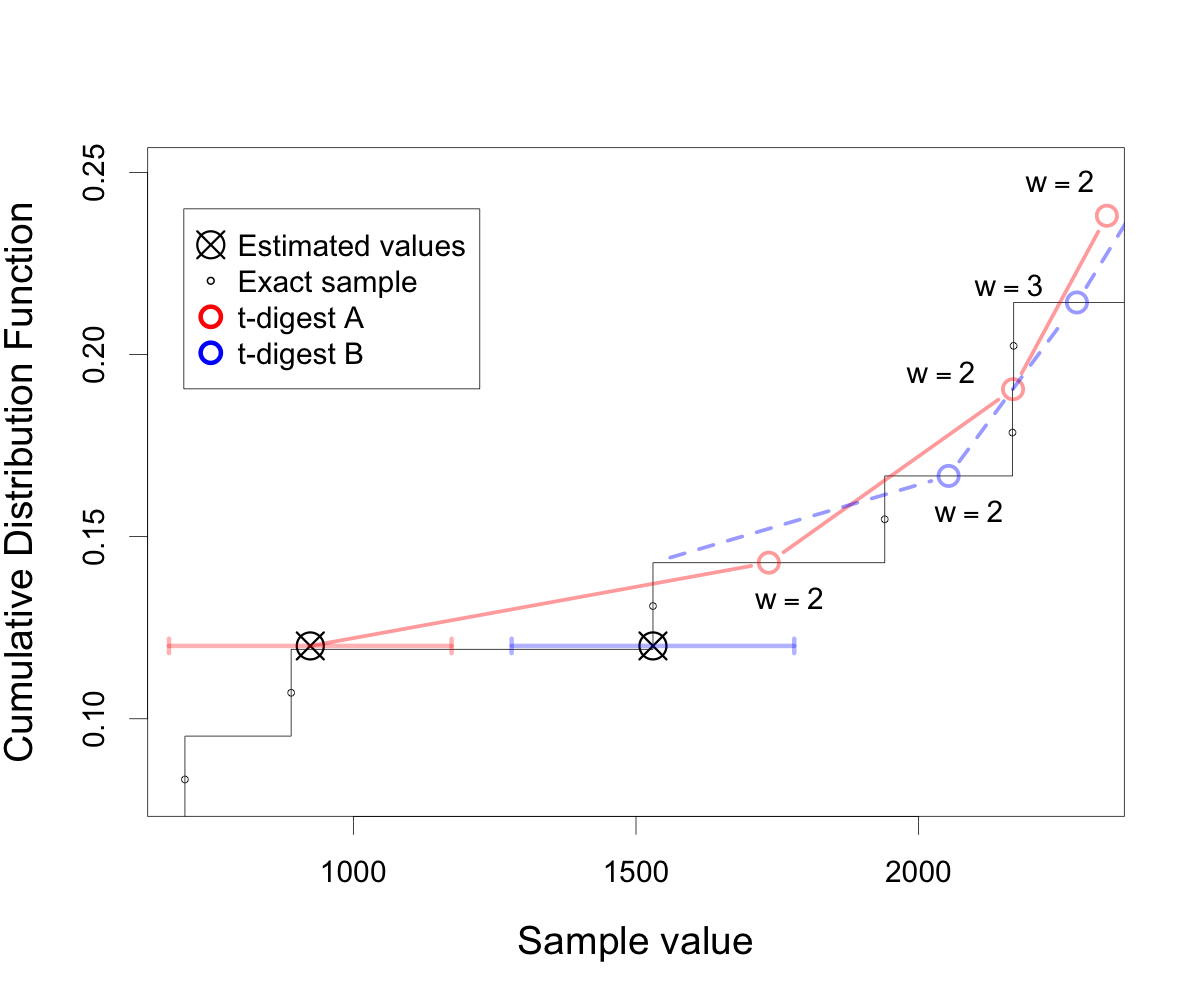 The code necessary to regenerate the figure can be found in [this gist](https://gist.github.com/tdunning/a10d79bc4cb3834cf2ecea96e70cb9f7#file-figure-r). The dark line with small circles represents the exact empirical CDF as determined by the actual data. With the t-digest, we use the mid-point rule so the CDF at a value exactly equal to a sample is half-way between the values to the left and right of the sample. In this example, t-digest A merged the samples at 1530 and 1940 into a centroid at 1735 and the samples at 2166 and 2168 into a centroid at 2167. This causes interpolation when the value of quantile(0.12) is computed and the resulting value of 923.8 is shown by the left-most circled X. The correct value of the empirical distribution for this quantile is 1530. The interpolated value is far from this correct value because the quantile desired is so close to the transition from one sample to the next. In contrast, t-digest B starts merging values slightly above this point so sample 1530 is still alone in a centroid. This means that digest B computes the precisely correct value of 1530 (represented by the right-most circled X). The threshold for the test is 5% of 10,000, however, so the test fails because the difference is 606.2. The fact that these samples have such a large difference is a major contributor here; if this difference were less than 500, the interpolation could not cause this error. It is the combination of the bad luck of the large difference right at the transition to multi-sample centroids that causes this problem. -- This is an automated message from the Apache Git Service. To respond to the message, please log on to GitHub and use the URL above to go to the specific comment. For queries about this service, please contact Infrastructure at: us...@infra.apache.org --------------------------------------------------------------------- To unsubscribe, e-mail: commits-unsubscr...@pinot.apache.org For additional commands, e-mail: commits-h...@pinot.apache.org