Just to close the loop on my contribution to this discussion: talking about
mdsh led to me going back and looking at it and I found some significant
limitations - basically I'd enhanced it enough to answer my
immediate questions but not carried on to making it production-quality. So
over the last couple of weeks I've done some work to make it more robust
and also added a man page. No promises, but if anyone's using mdsh I
suggest upgrading to the latest.
David

On Tue, Sep 22, 2026 at 12:14 PM David Boyce <[email protected]>
wrote:

> Yes, tracking which files were opened by which shell commands and how
> (read/write/create/remove) was the original purpose of mdsh; other features
> were added later. Below is the output of "make demo" which shows it
> detecting various mods to files like foo and bar. The ==-== is just a
> conventional string to make grepping out mdsh verbosity easier.
>
> $ make demo
> ############ Testing mdsh path tracking with MDSH_PATHS=foo*:bar*:baz*
> ############
> rm -f foo* bar* baz*
> ./mdsh -c 'uname > foo'
> mdsh: ==-== CREATED: foo
> ./mdsh -c 'touch bar'
> mdsh: ==-== CREATED: bar
> ./mdsh -c 'touch foo bar'
> mdsh: ==-== MODIFIED: bar
> mdsh: ==-== MODIFIED: foo
> ./mdsh -c 'uname > foo; uname > baz'
> mdsh: ==-== CREATED: baz
> mdsh: ==-== MODIFIED: foo
> ./mdsh -c 'grep -c . foo bar baz > /dev/null'
> mdsh: ==-== ACCESSED: bar
> mdsh: ==-== ACCESSED: baz
> mdsh: ==-== ACCESSED: foo
> ./mdsh -c 'rm -f foo* bar* baz*'
> mdsh: ==-== REMOVED: bar
> mdsh: ==-== REMOVED: baz
> mdsh: ==-== REMOVED: foo
>
> Regarding the hardcoded list of POSIX shells, I find it annoying and
> fragile and I think the simplest solution is to add a variable like
> .MAKE_POSIX_SHELLS which can override the list. I've thought about
> contributing that but have never tried.
>
> BTW I just added a "load average" field to the csv format, figuring it
> might be useful in weighting elapsed times.
>
> David
>
> On Tue, Sep 22, 2026 at 3:31 AM Tim Murphy <[email protected]> wrote:
>
>>
>> Dear David,
>>
>> On Mon, 21 Sept 2026 at 22:17, David Boyce <[email protected]>
>> wrote:
>>
>>> Tim,
>>>
>>> I'd hate to trigger another round of "Hey, look at mine!" but, well,
>>> take a look at my similar contribution. Mine's called MDSH ("the Make
>>> DIagnostic Shell") and as the name implies it's implemented at the shell
>>> level vs the make level as yours is. One of the features MDSH offers is
>>> timings similar to yours so it might at least make sense to compare them
>>> and take the best from each. MDSH is at https://github.com/boyski/mdsh.
>>> Documentation is partly in the README and partly in the usage message.
>>>
>>
>> Haahahahaha :-)   I'm delighted if we DO have a round of "hey look at
>> mine".   It's far more fun than the usual thing and I think it's really
>> encouraging to know that others have noticed some of the same needs.  I am
>> also delighted to have my assumptions blown up when I see another approach
>> - excellent!
>>
>>
>> MDSH documentation is a bit minimal but for timing uses the basic drill
>>> is to create a temp dir e.g. "mkdir /tmp/timings", then run make as
>>> "MDSH_DB=/tmp/timings make SHELL=mdsh". Here's the relevant paragraph from
>>> the usage message:
>>>
>>> MDSH_DB: if present, points to a writable directory. Each shell command
>>> will drop a file into that directory, named by its start time in
>>> nanoseconds and pid, summarizing the command in .csv format:
>>> [start time,pid,ppid,retcode,run time,user time,sys
>>> time,$(MAKELEVEL),pwd,cmd]
>>>
>>> One advantage of implementing this at the shell level is that it isn't
>>> wedded to make per se, it can work with any tool that does its work by
>>> forking off shell processes. A potential downside is that overriding make's
>>> $(SHELL) disables the fast path so all recipes will fork a shell, but that
>>> can also be considered an upside since it puts all recipes on an equal
>>> footing for time-comparison purposes.
>>>
>>> I think that's very powerful.   I may have misread but it looks like it
>> can check if the target has actually changed as a result of the rule - THAT
>> is a super powerful feature and one I think make in general should offer
>> for targets that have a high number of other targets dependent on them -
>> things which can trigger a major rebuild  In operating systems there's
>> quite often some kind of config.h where the major settings are kept and if
>> that gets touched then it triggers an almost total rebuild which can
>> sometimes be for nothing. So a change check could be comparatively slow in
>> that one case and yet still make builds overall much more joyful.  With the
>> timing data that we can collect, we could decide if the impact of one
>> target changing warrants a more expensive change test than merely the file
>> modification time.
>>
>> Before GNU make had output synchronisation I worked in a team where we
>> did it using a "shell wrapper" so I'm a little familiar with the idea and
>> it certainly could be used outside of make.
>>
>> You mention in the README how MDSH  has to deal with GNU make's builtin
>> idea of the shell name - I remember having to deal with that bloody
>> problem.   What I remember dreaming about at the time was that we could
>> make the shell wrapper into an actual shell that would be cross-platform.
>> It would need some but not all features.  It would have builtin sed and
>> grep (or equivalent) and loops and pipes.  The great thing would be that we
>> could forget about having to use cygwin on windows or maintaining 2 copies
>> of the build rules and testing them both every time anything changed.
>>
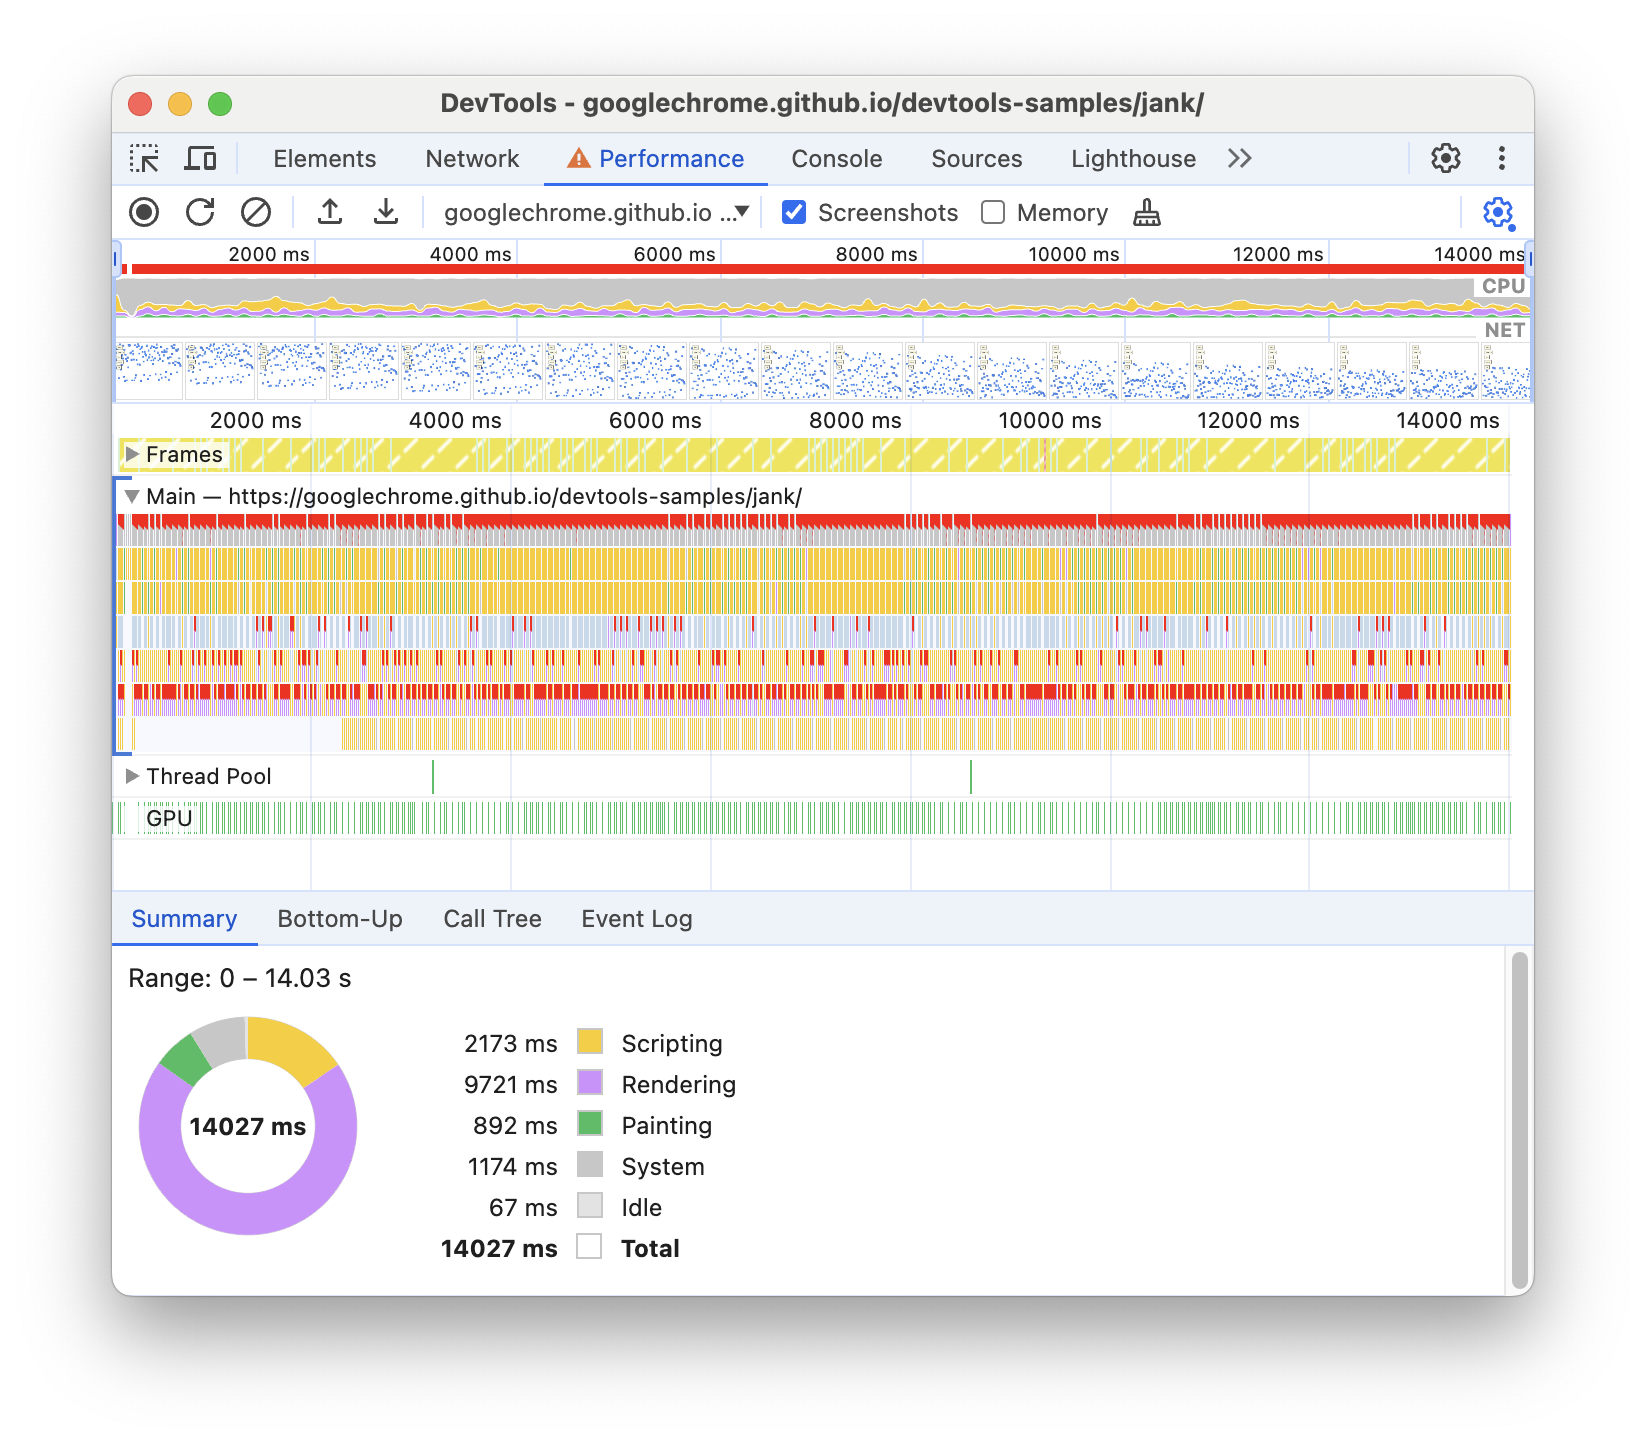
>> On timing I was hoping to achieve some visualisations which would show
>> when the machine was being lightly loaded and give some intuitive view of
>> how parallel the build is - so that one can see at a glance if there are
>> long periods of serial-ness to it for example and get an idea of which
>> targets cause that.  The major problem with this is that one had no idea
>> which CPU some rule runs on or whether it uses multiple CPUs in effect.  I
>> think any graphs one could draw would only be "indicative" rather than
>> accurate but still potentially helpful.
>>
>>
>> https://developer.chrome.com/static/docs/devtools/performance/image/profiling-results_1440.png
>>
>> Google chrome has a viewer for trace data (or it used to) and I thought
>> one might convert timing data to that and get a view as above ^^.  I was
>> motivated by seeing some news about the javascript build thingy called
>> "bun" getting a feature like this which I've lazily thought of trying for
>> years without taking any action.
>>
>> https://lalitm.com/post/buildprof/
>>
>> Best regards,
>>
>> Tim
>>
>>
>>
>>> David
>>>
>>> On Fri, Sep 18, 2026 at 6:05 PM Tim Murphy <[email protected]> wrote:
>>>
>>>> Hi,
>>>>
>>>> This is about being able to get timing information out of make - how
>>>> long it took to build any particular target.  It's a bit of an experiment
>>>> hence I'm not proposing it as a some new change but it's just a branch on a
>>>> github repo that can be tried out.
>>>>
>>>>   https://github.com/tnmurphy/gmake-experimental/tree/feature/profile
>>>>
>>>> You do a build as normal but with the additional
>>>> parameter --profile-targets e.g.
>>>>
>>>>   ./make --profile-targets -j 12
>>>>
>>>> This creates a file like this:
>>>>     make_profile-30868.csv
>>>>
>>>> ^^ the number is the PID of the make process - this helps deal with
>>>> make rerunning itself several times or being run with multiple targets.
>>>>  It might be useful to include the make goals in the file to make it clear
>>>> what was happening.
>>>>
>>>> ... with contents like this:
>>>>
>>>> "Start Time (s)","Duration (s)", "Notional CPU", "File"
>>>> 1789768586.496741 0.003517, 0, "src/config.h"
>>>> 1789768586.501650 0.017913, 8, "src/getopt.o"
>>>> ...
>>>> 1789768586.642658 0.395959, 4, "src/remake.o"
>>>> 1789768586.578634 0.467375, 10, "src/main.o"
>>>> 1789768586.718571 0.359135, 8, "src/variable.o"
>>>> 1789768586.624985 0.616308, 3, "src/read.o"
>>>> 1789768587.241335 0.034635, 3, "make"
>>>>
>>>>
>>>> The "Duration" column and the "file" column are self explanatory, I
>>>> think.
>>>>
>>>> "Start Time" is an absolute system time. I think this is useful rather
>>>> than starting from zero because of recursive builds where its probably
>>>> better to be able to merge times together from several recursive
>>>> invocations.
>>>>
>>>> The "Notional CPU" field is an attempt to link jobs up such that jobs
>>>> on the same notional CPU would happen one after the other.  It's a bit of
>>>> an experiment to enable one to create visualisations and this is something
>>>> one perhaps
>>>> doesn't need in make itself - it's just that the timing isn't really
>>>> accurate enough to allocate things correctly. In any case it's something
>>>> which could change or go.
>>>>
>>>> There's a MAKE_PROFILE_BASE variable which can be set to change the
>>>> base name of each profile dump.
>>>>
>>>> Anyhow I hope that this could either be useful or spark an idea or two.
>>>>
>>>> Best regards,
>>>>
>>>> Tim
>>>>
>>>